
안녕하세요 늑대양입니다 :)
요즘 날씨가 정말 좋네요!

오늘은 가짜연구소 스터디 2주차 학습내용을 안내해드리도록 하겠습니다.
프로그램: Data Scientist - Python - 황지*님/이다*님
2주차 학습 주제: Intermediate Python

2주차 학습 material URL: https://www.datacamp.com/courses/intermediate-python
Intermediate Python Course
In this intermediate Python course, learn to visualize real data with Matplotlib's functions and get to know new data structures such as the pandas DataFrame.
www.datacamp.com
Course Description:
Learning Python is crucial for any aspiring data science practitioner. Learn to visualize real data with Matplotlib’s functions and get acquainted with data structures such as the dictionary and pandas DataFrame. This four-hour intermediate course will help you to build on your existing Python skills and explore new Python applications and functions that expand your repertoire and help you work more efficiently.
You'll discover how dictionaries offer an alternative to Python lists, and why the pandas dataframe is the most popular way of working with tabular data. In the second chapter of this course, you’ll find out how you can create and manipulate datasets, and how to access them using these structures. Hands-on practice throughout the course will build your confidence in each area.
As you progress, you’ll look at logic, control flow, filtering and loops. These functions work to control decision-making in Python programs and help you to perform more operations with your data, including repeated statements. You’ll finish the course by applying all of your new skills by using hacker statistics to calculate your chances of winning a bet.
Once you’ve completed all of the chapters, you’ll be ready to apply your new skills in your job, new career, or personal project, and be prepared to move onto more advanced Python learning.
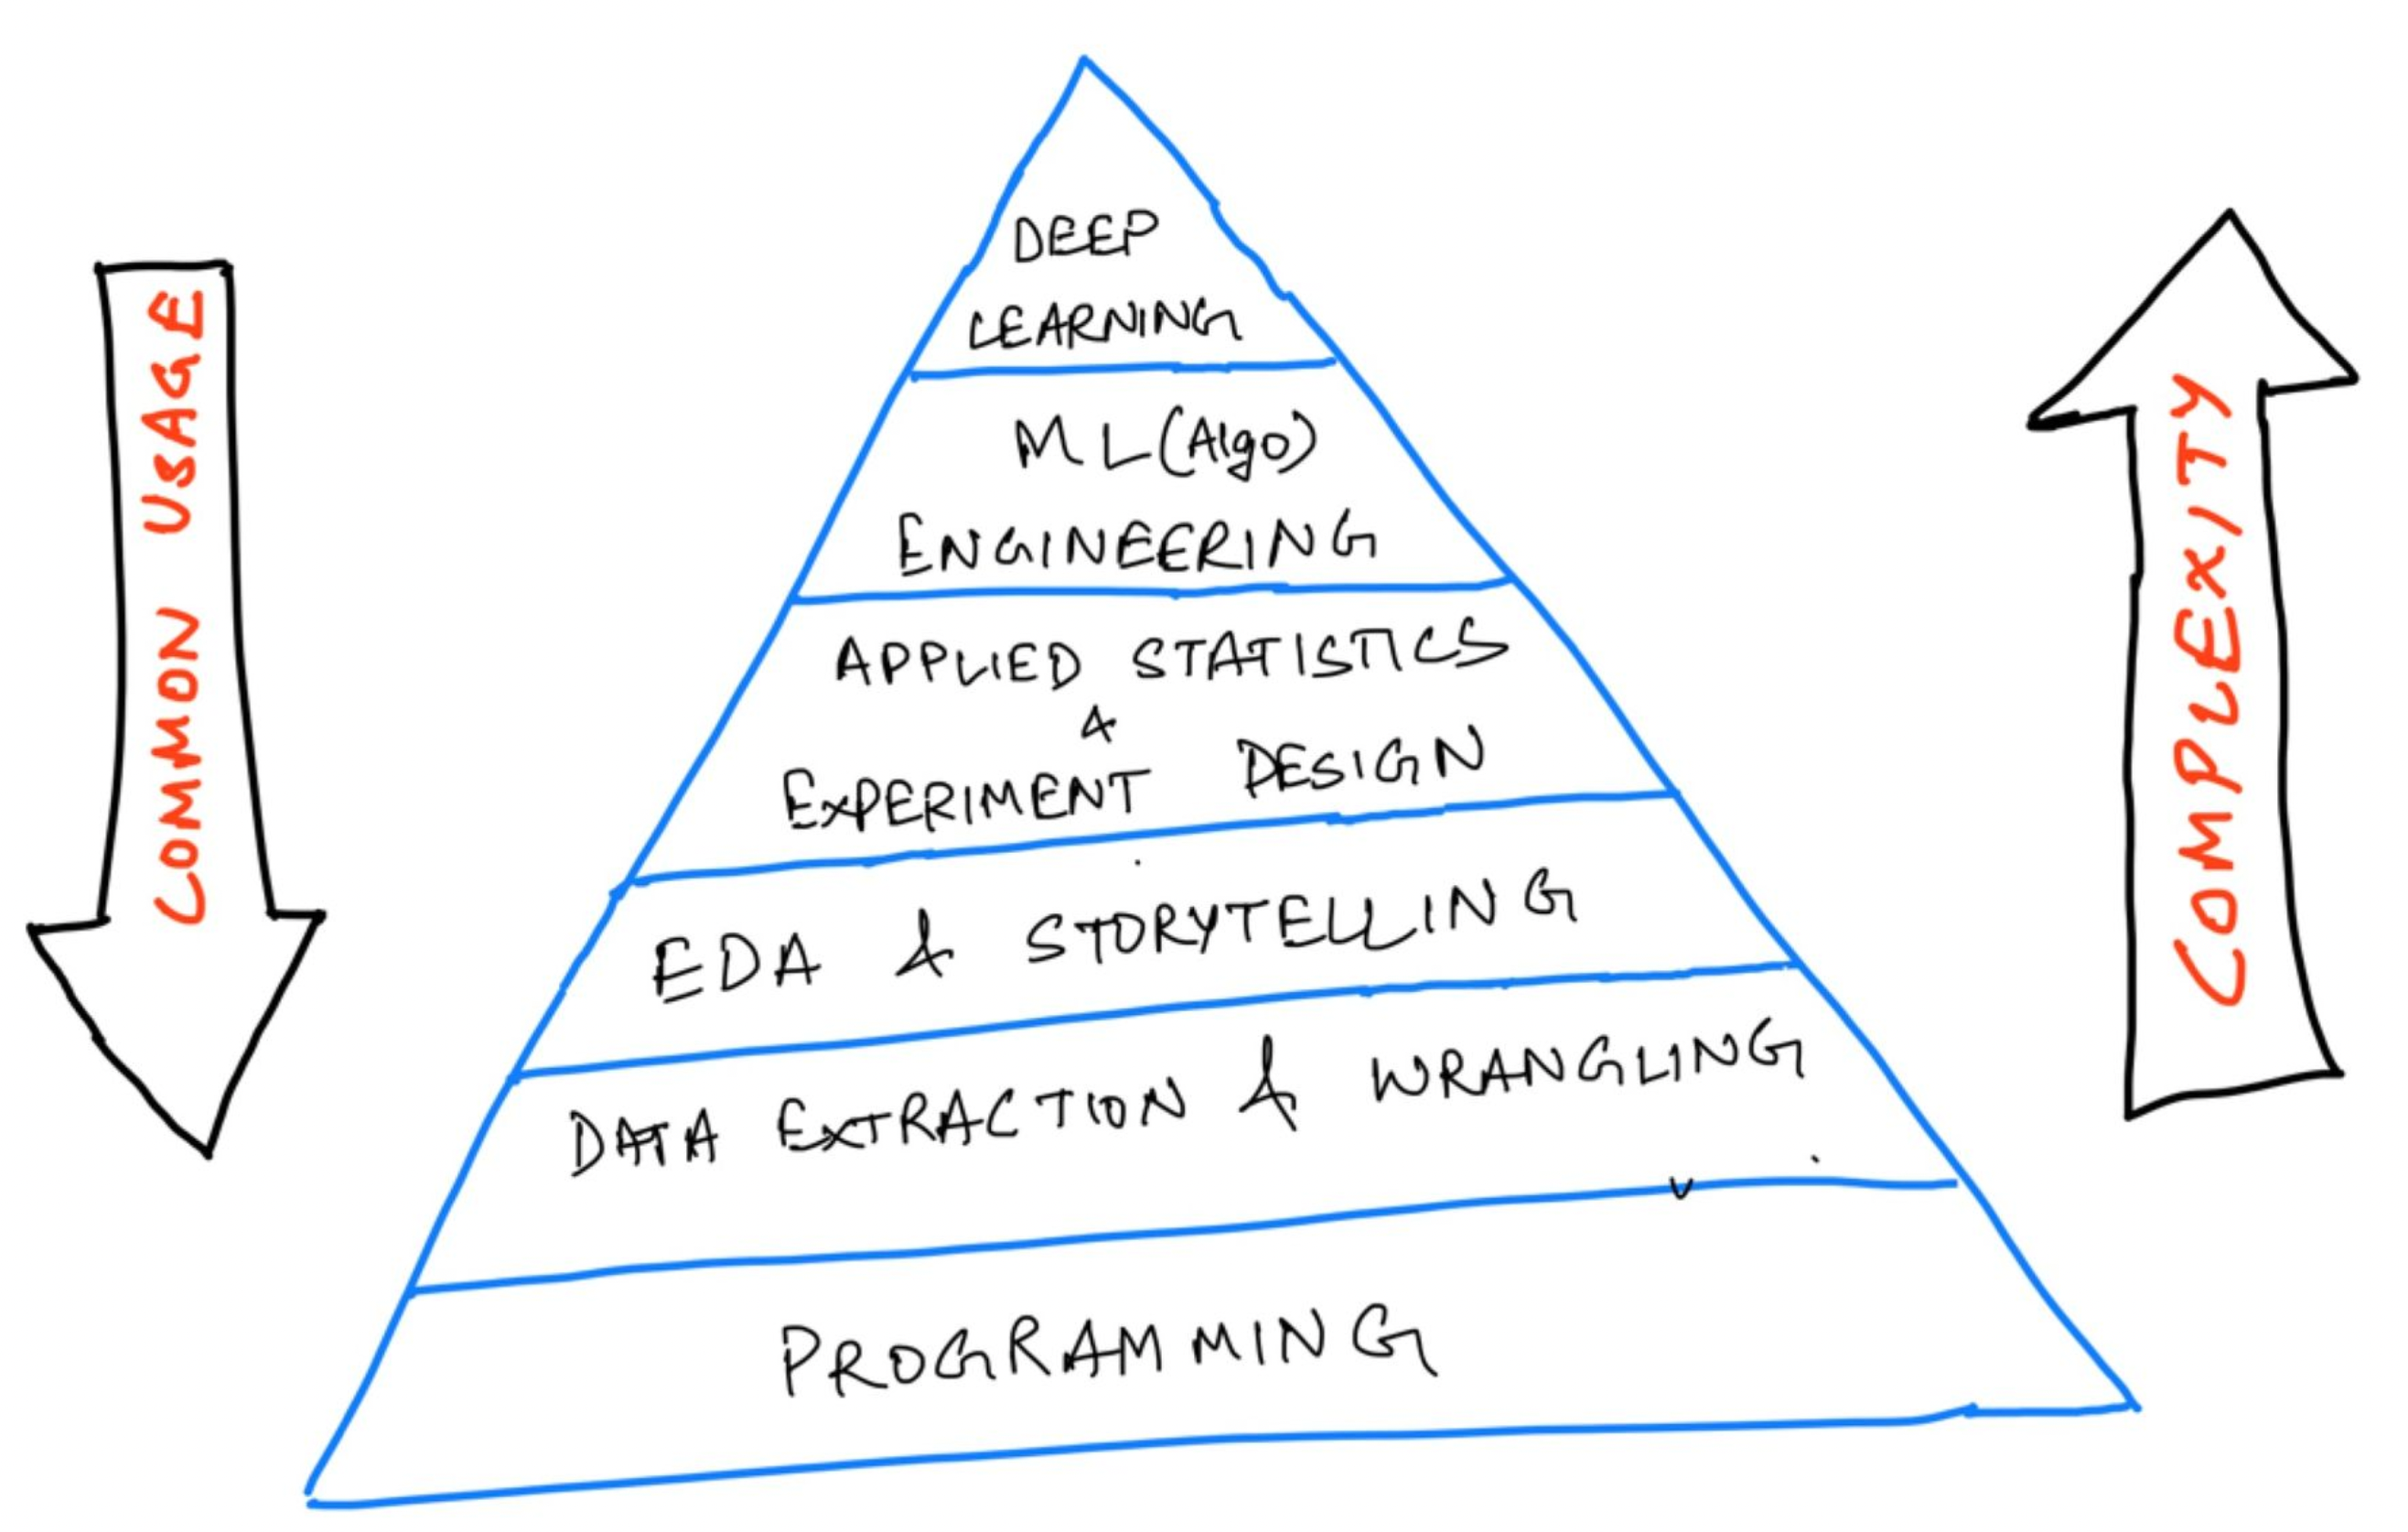
Index:
- Matplotlib
- Dictionaries & Pandas
- Logic, Control Flow and Filtering
- Loops
- Case Study: Hacker Statistics
Matplotlib:
Basic plots with Matplotlib:
- Visualization
- Data Structure
- Control Structures
- Case Study
Data visualization
- Very important in Data Analysis
- Explore data
- Report insights
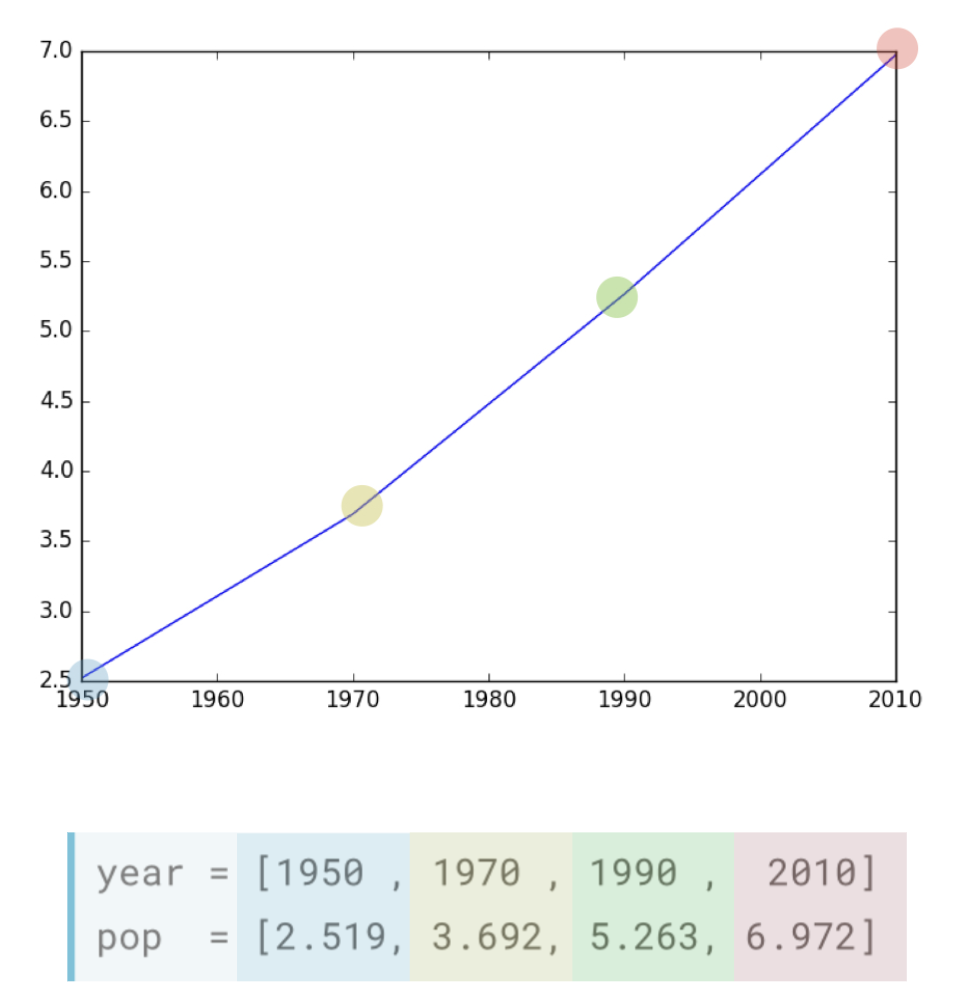
Matplotlib
# example of matplotlib
import matplotlib.pyplot as plt
year = [1950, 1970, 1990, 2010]
pop = [2.519, 3.692, 5.263, 6.792]
plt.plot(year, pop) # horizontal, vertical
plt.show()
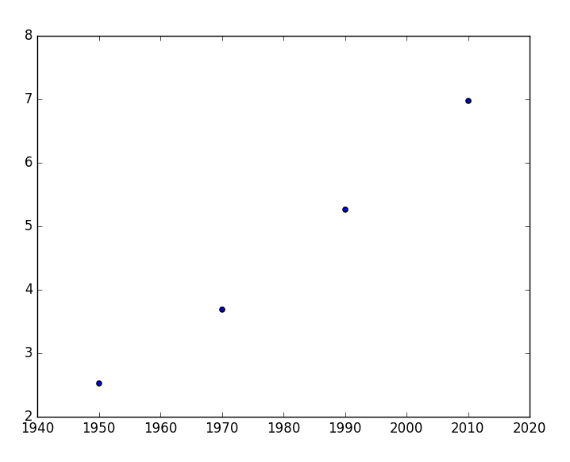
Scatter plot
# example of scatter plot
import matplotlib.pyplot as plt
year = [1950, 1970, 1990, 2010]
pop = [2.519, 3.692, 5.263, 6.792]
plt.scatter(year, pop)
plt.show()
Let's practice!
Histogram:
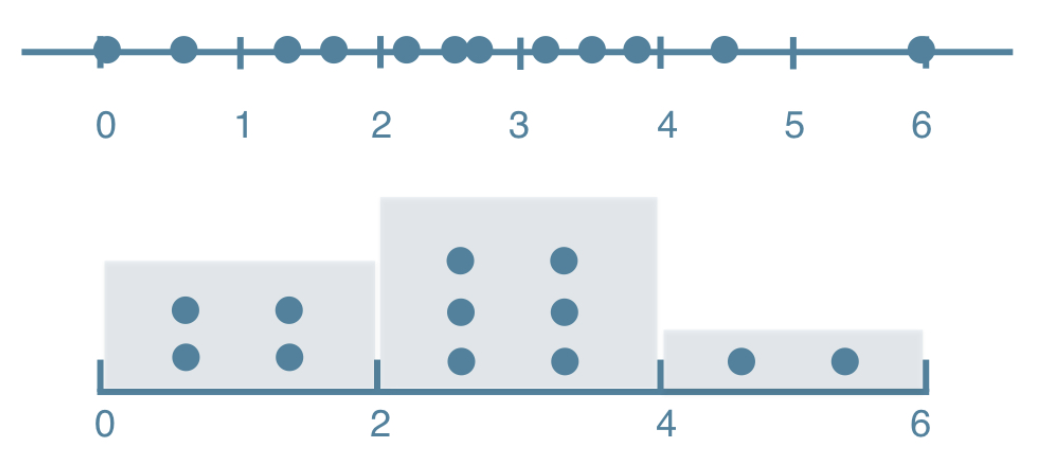
- Explore dataset
- Get idea about distribution
Matplotlib:
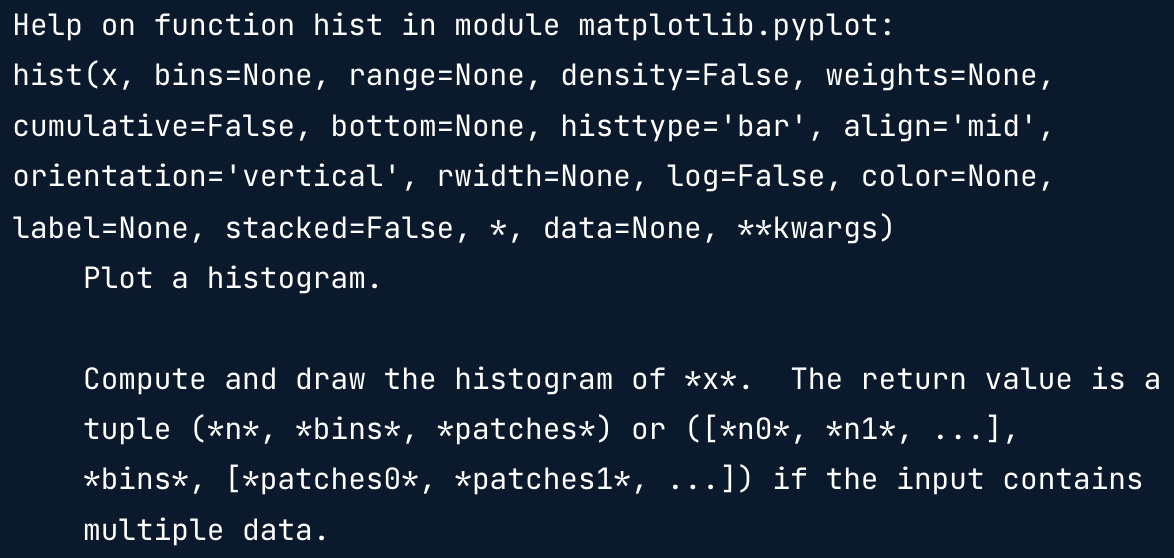
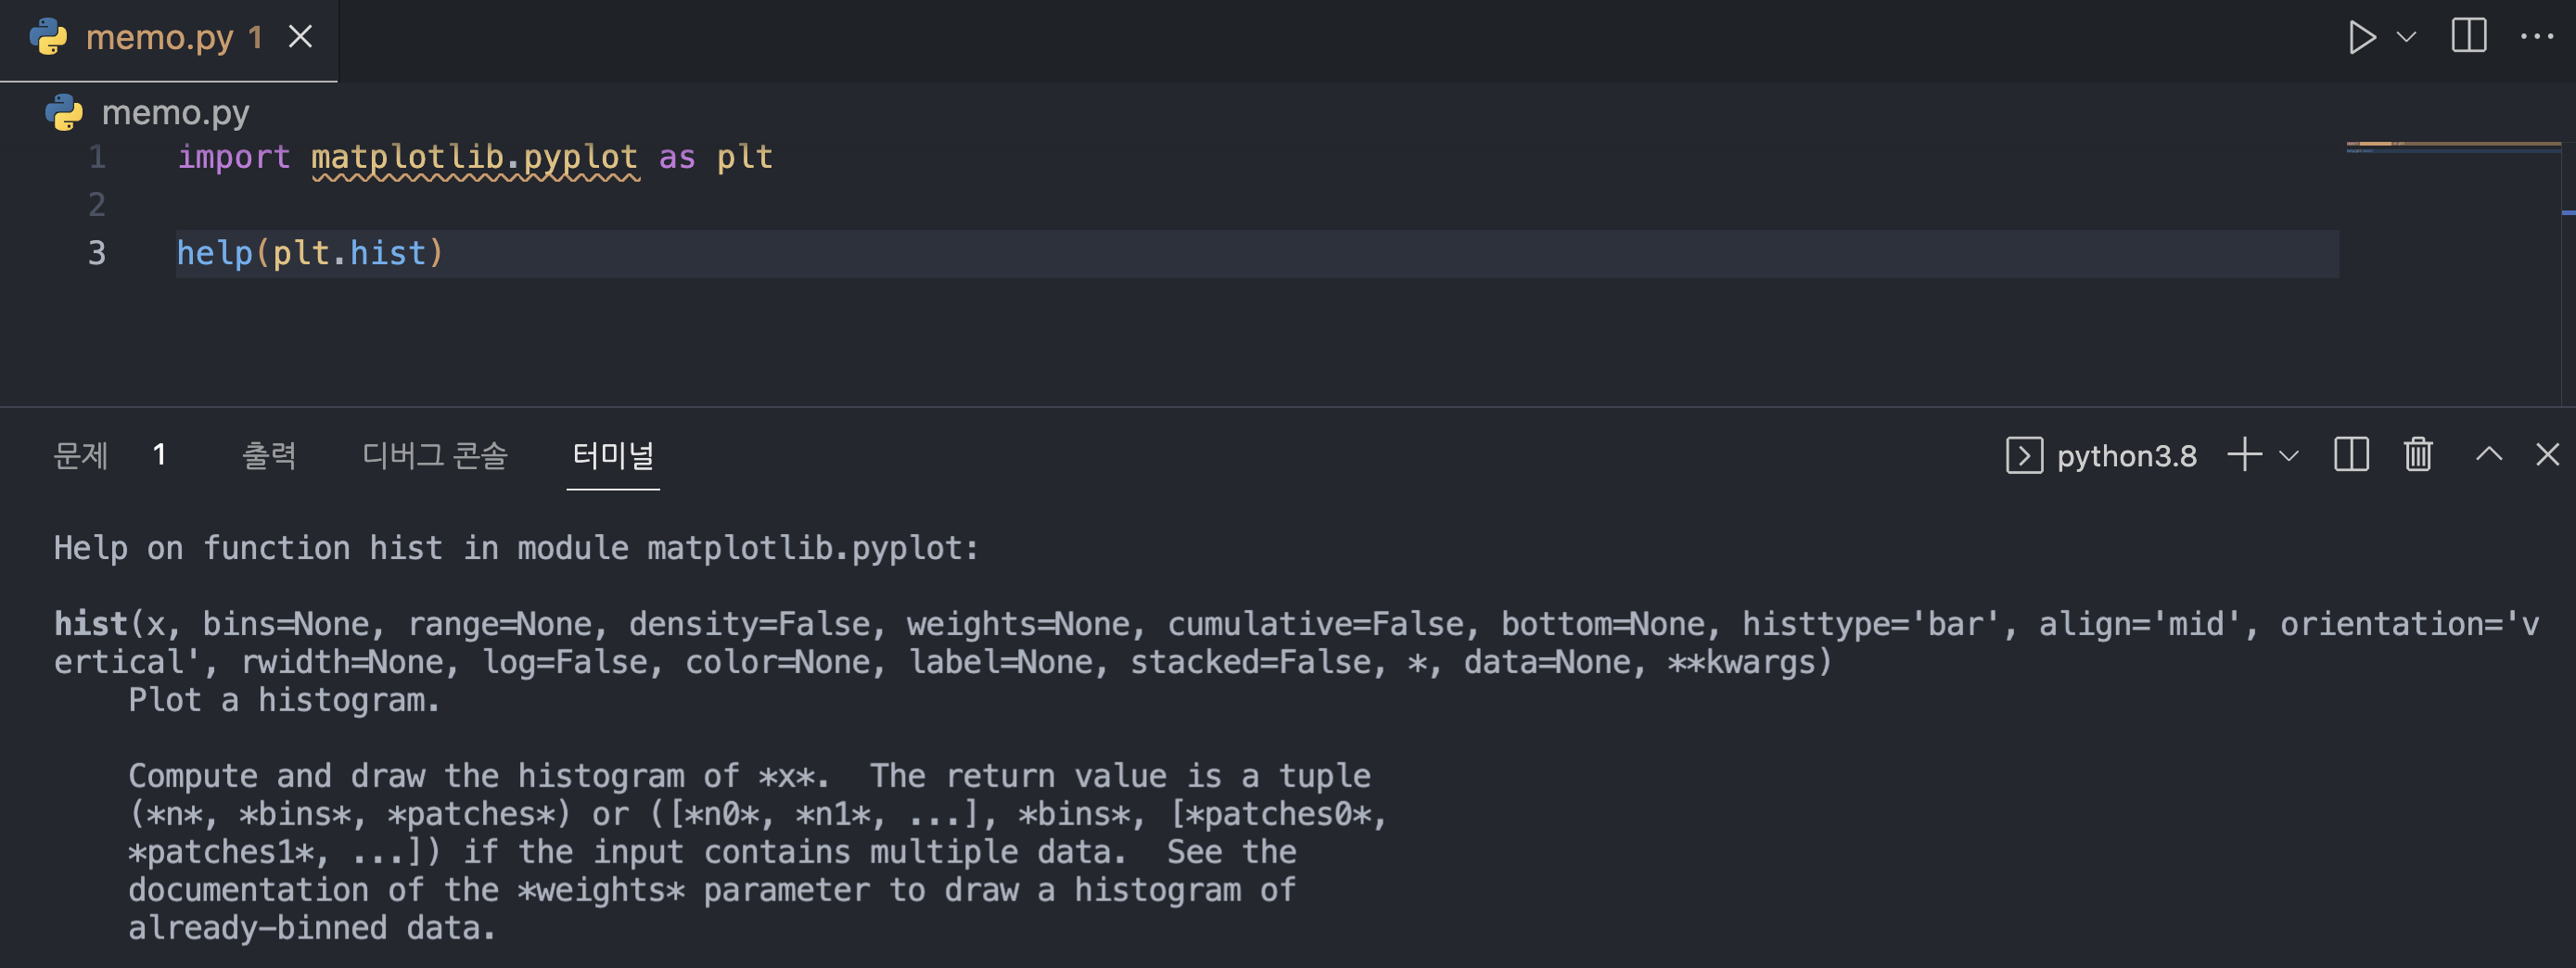
import matplotlib.pyplot as plt
help(plt.hist)
Matplotlib example
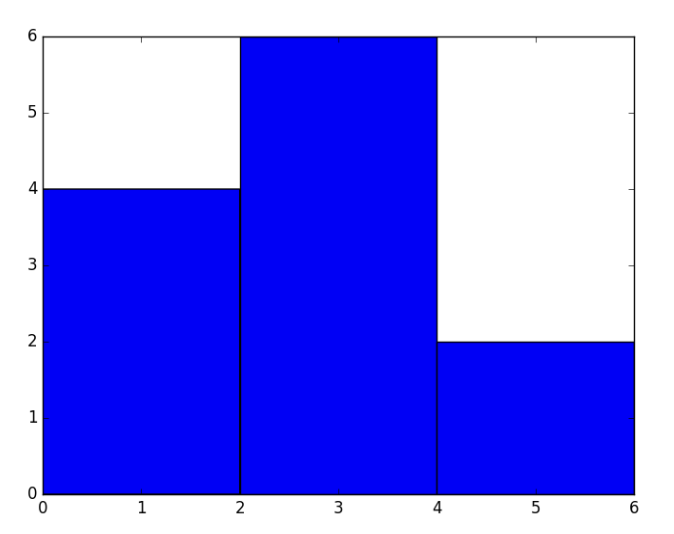
# matplotlib example
values = [0, 0.6, 1.4, 1.6, 2.2, 2.5, 2.6, 3.2, 3.5, 3.9, 4.2, 6]
plt.hist(values, bins=3) # bins 항목을 명시하지 않을 경우, default 10!
plt.show()
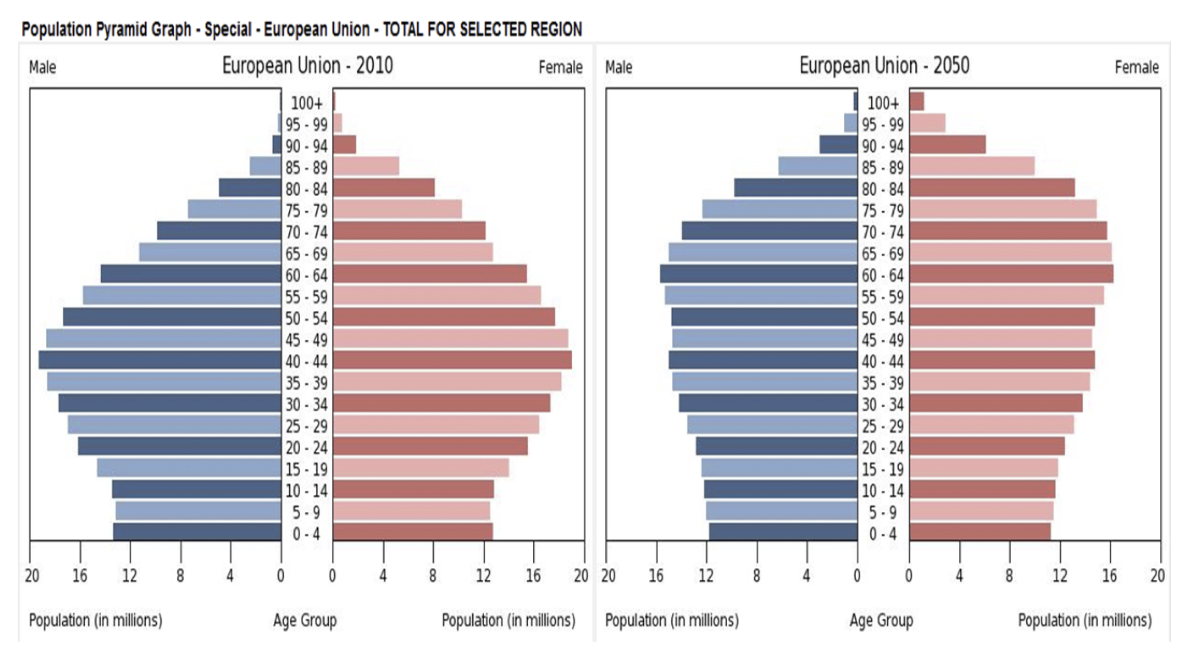
Population pyramid
Let's practice!
Customization:
Data visualizaiotn
- Many options
- Different plot types
- Many customizations
- Chlice depends on
- Data
- Story you want to tell
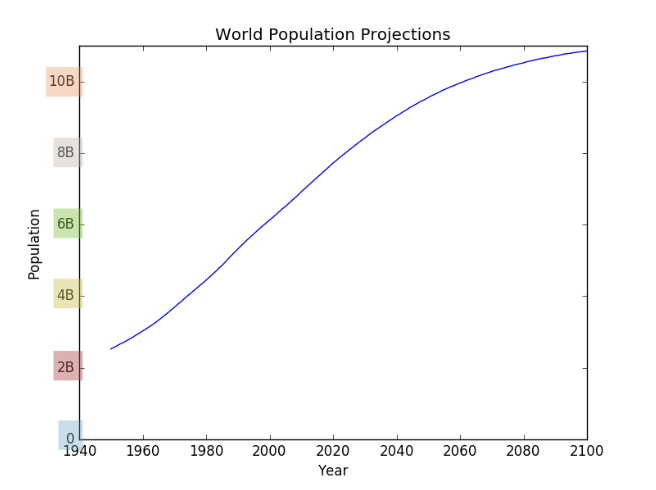
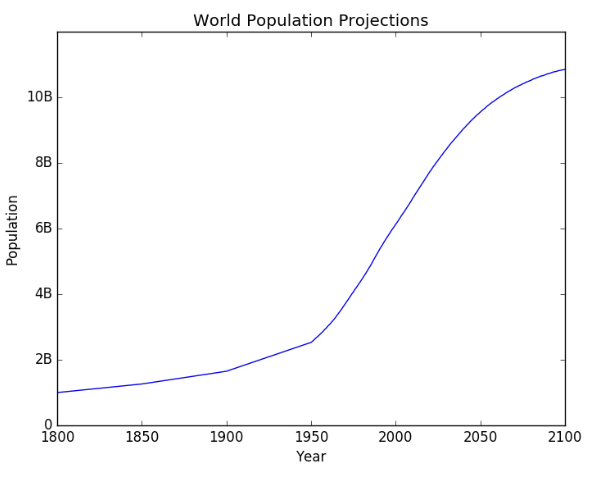
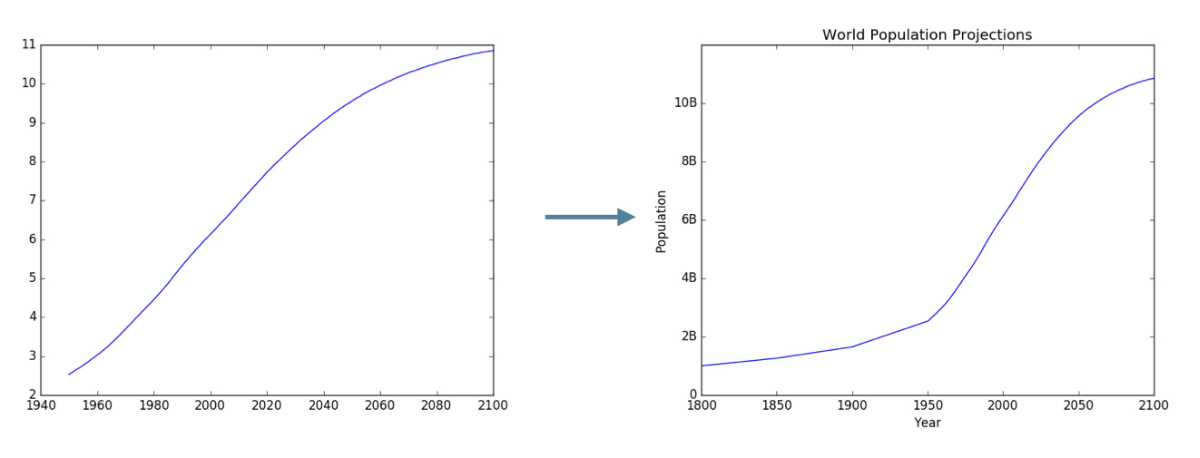
Basic plot
# example of basic plot
# population.py

import matplotlib.pyplot as plt
year = [1950, 1951, 1952, ... , 2100]
pop = [2.538, 2.57, 2.62, ... , 10.85]

# Add more data
year = [1800, 1850, 1900] + year
pop = [1.0, 1.262, 1.650] + pop


plt.plot(year, pop)

plt.xlabel('Year')
plt.ylabel('Population')
plt.title('World Population Projection)
plt.yticks([0, 2, 4, 6, 8, 10],
           ['0', '2B', '4B', '6B', '8B', '10B'])

plt.show()
Before vs. after
Let's practice!
Dictionaries
Dictionaries, Part 1
Sooooooo useful!!!
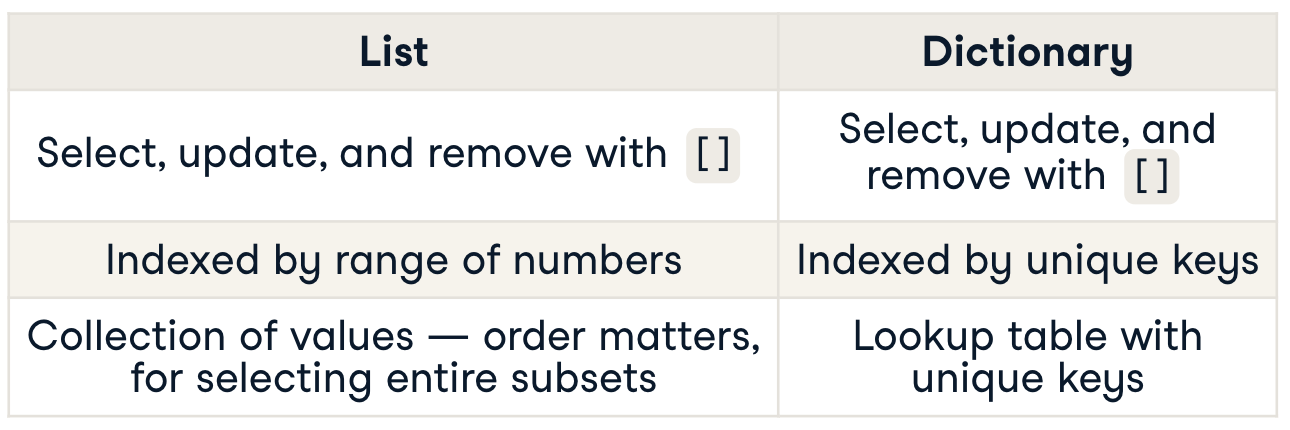
List
# List example
pop = [30.55, 2.77, 39.21]
countries = ["afghanistan", "albania", "algeria"]
ind_alb = countries.index("albania")
ind_alb

>1

pop[ind_alb]

>2.77- Not convenient
- Not intuitive
Dictionary
# Dictionary example
pop = [30.55, 2.77, 39.21]
countries = ["afghanistan", "albania", "algeria"]

world = {"afghanistan":30.55, "albania": 2.77, "algeria":39.21}
world{"albania"]

>2.77
Let's practice!
Dictionaries, Part 2
Recap
# Recap
world = {"afghanistan":30.55, "albania": 2.77, "algeria":39.21}
world{"albania"]

>2.77


world = {"afghanistan":30.55, "albania": 2.77, "algeria":39.21, "albania":2.81}
world

>{'afghanistan':30.55, 'albania':2.81, 'algeria':39.21} # 딕셔너리의 키값은 유일해야하며, 동일키에 대한 밸류가 들어올 경우, 마지막에 들어온 값으로 대체!- Keys have to be "immutable" objects
# Immutable
{0:"hello", True:"dear", "two":"world"}

>{0: 'hello', True: 'dear', 'two': 'world'}


{["just", "to", "test"]: "value"}

>TypeError: unhashable type: 'list'
Principality of Sealand
# Dictionary
world["sealand" = 0.000027
world

>{'afghanistan':30.55, 'albania':2.81, 'algeria':39.21, 'sealand': 2.7e-05}


"sealand" in world

>True


world["sealand"] = 0.000028
world

>{'afghanistan':30.55, 'albania':2.81, 'algeria':39.21, 'sealand': 2.8e-05}


del(world["sealand"])
world

>{'afghanistan':30.55, 'albania':2.81, 'algeria':39.21}
List vs. Dictionary
Let's practice!
Pandas
Pandas, Part 1
Tabular dataset examples
Datasets in Python
- 2D NumPy array?
- One data type
- pandas!
- High level data manipulation tool
- Wes McKinney
- Built on NumPy (More high level!)
- DataFrame
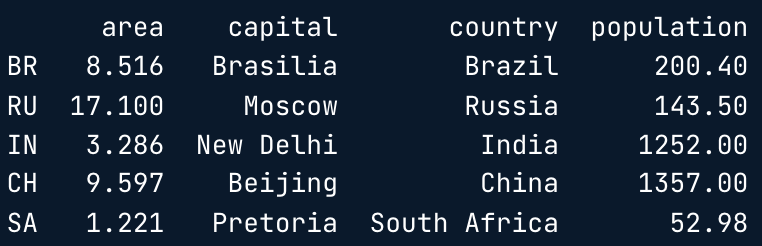
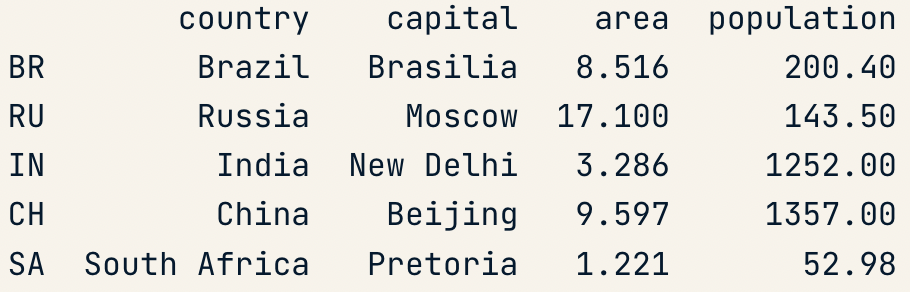
DataFrame
brics
DataFrame from Dictionary
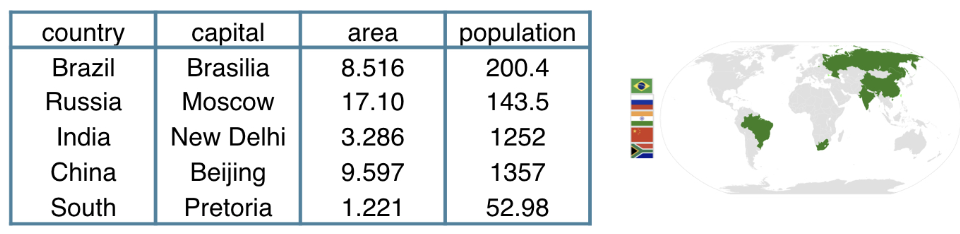
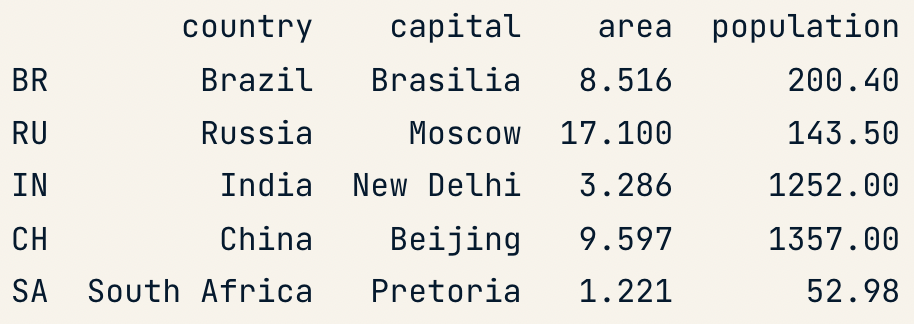
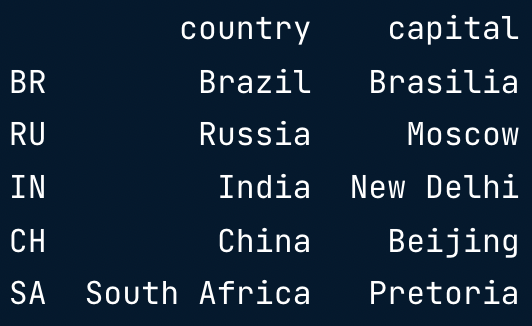
dict = {
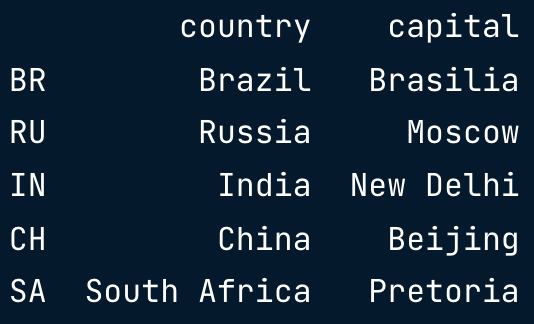
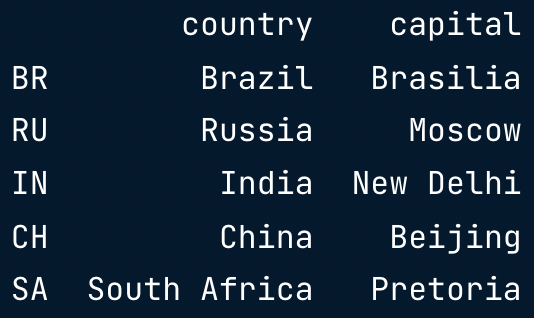
"country":["Brazil", "Russia", "India", "Chinda", "South Africa"],
"capital":["Brasilia", "Moscow", "New Delhi", "Beijing", "Pretoria"],
"area":[8.516, 17.10, 3.286, 9.597, 1.221]
"population":[200.4, 143.5, 1252, 1357, 52.98] }
- keys (column labels)
- values (data, column by column)
import pandas as pd
brics = pd.DataFrame(dict)
brics.index = ["BR", "RU", "IN", "CH", "SA"]
brics
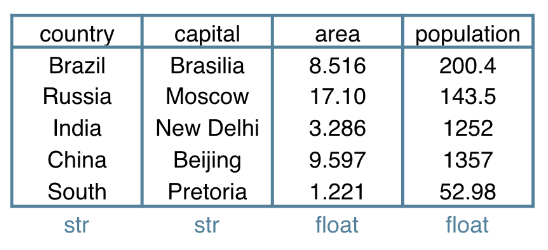
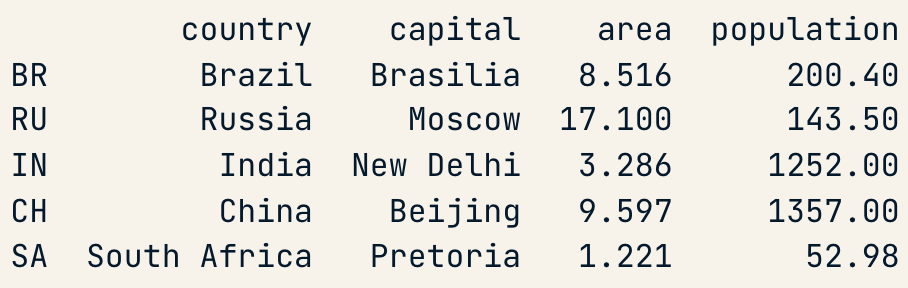
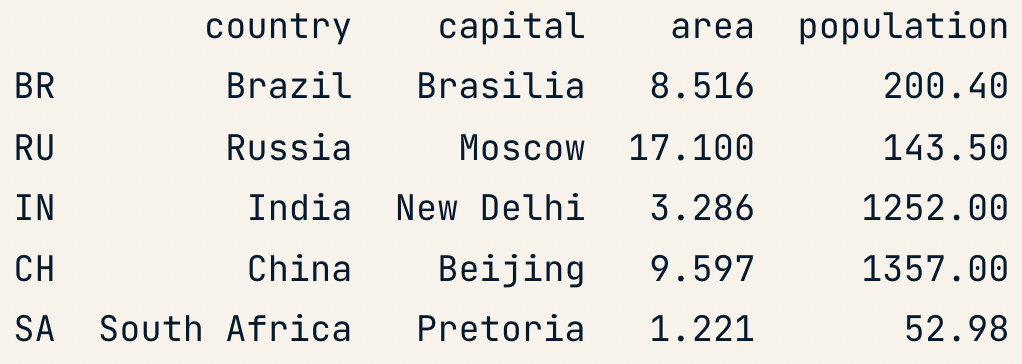
DataFrame from CSV file
# brics.csv
,country, capital, area, population
BR,Brazil,Brasilia,8.516,200.4
RU,Russia,Moscow,17.10,143.5
IN,India,New Delhi,3.286,1252
CH,China,Beijing,9.597,1357
SA,South Africa,Pretoria,1.221,52.98
- CSV = comma-separated values
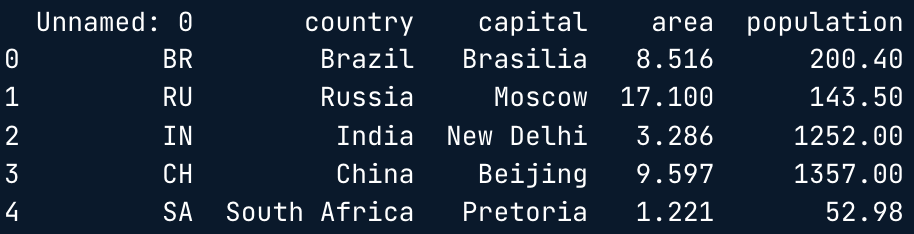
brics = pd.read_csv("path/to/brics.csv")
brics
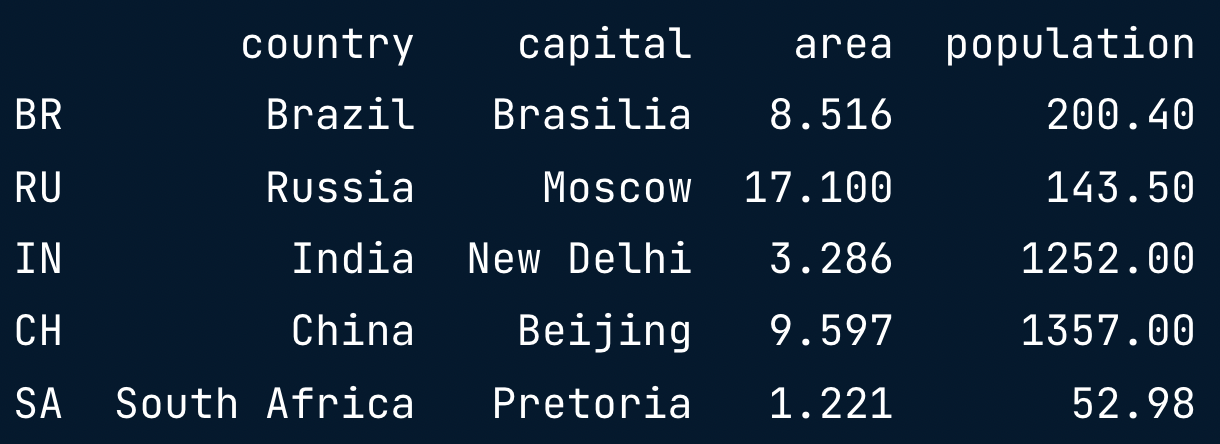
brics = pd.read_csv("path/to/brics.csv", index_col = 0)
brics
Let's practice!
Pandas, Part 2
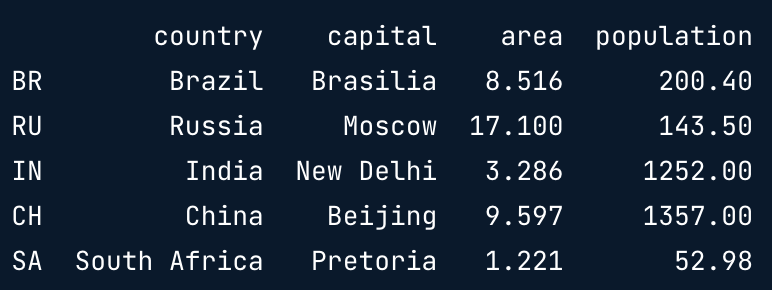
brics
import pandas as pd
brics = pd.read_csv("path/to/brics.csv", index_col = 0)
brics
Index and select data
- Square brackets
- Advanced methods
- loc
- iloc
Column Access [ ]
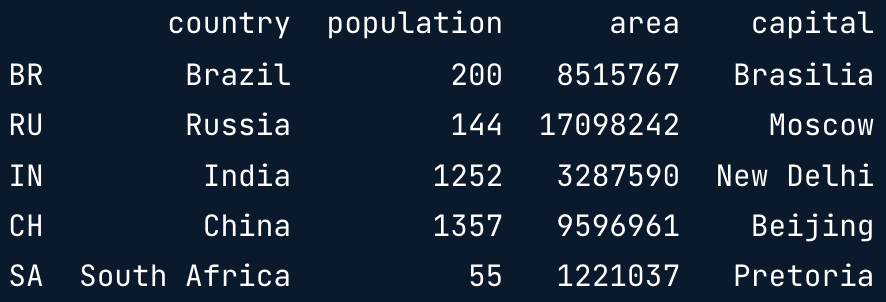
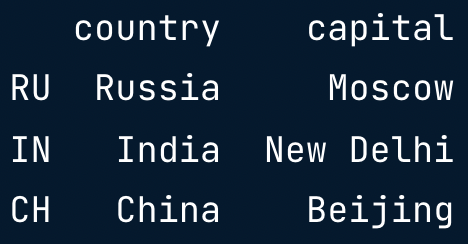
brics["country"]
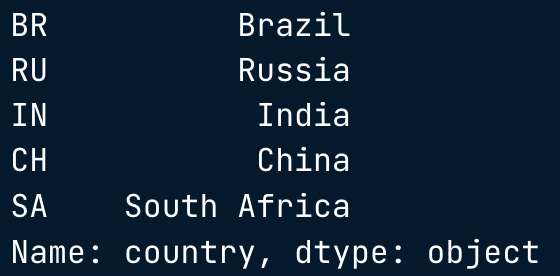
type(brics["country"])

- 1D labelled array
brics[["country"]]
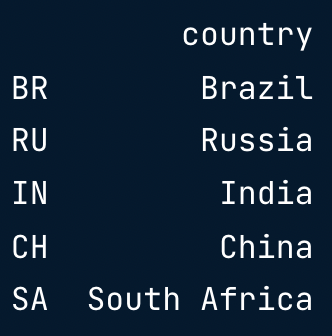
type(brics[["country"]]

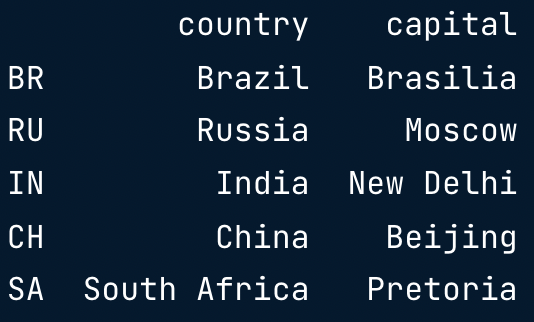
brics[["country", "capital"]]
Row Access [ ]
brics[1:4]
Discussion [ ]
- Square brackets: limited functionality
- Ideally
- 2D NumPy arrays
- my_array[rows, columns]
- pandas
- loc (labeled-based)
- iloc (integer position-based)
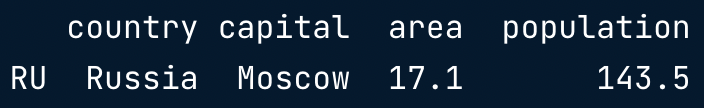
Row Access loc
brics.loc["RU"]
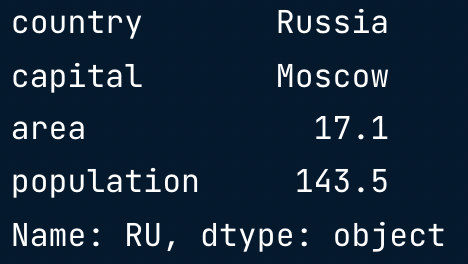
- Row as apandas Series
brics.loc[["RU"]]
- DataFrame
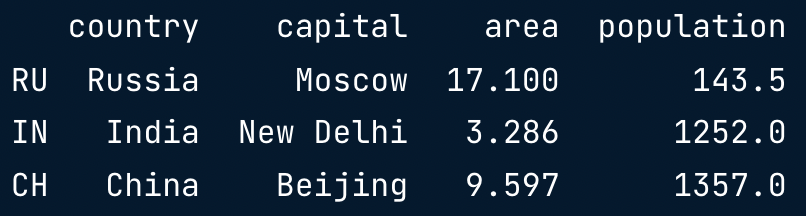
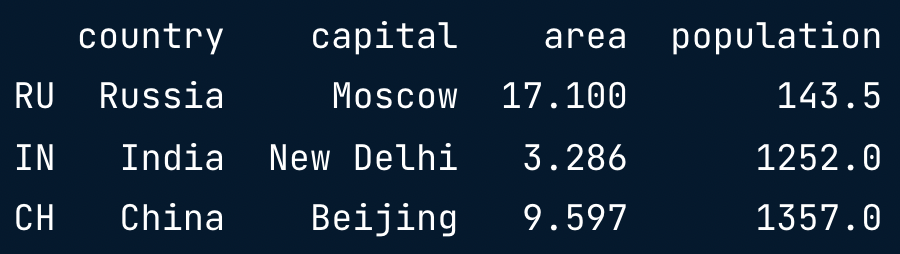
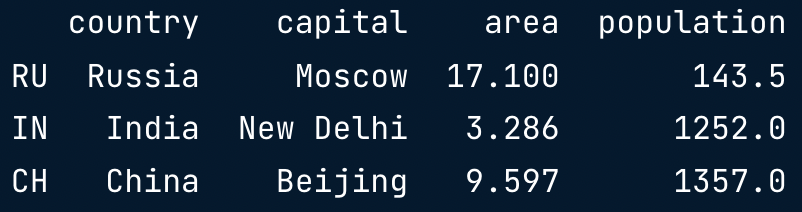
brics.loc[["RU", "IN", "CH"]]
Row & Column loc
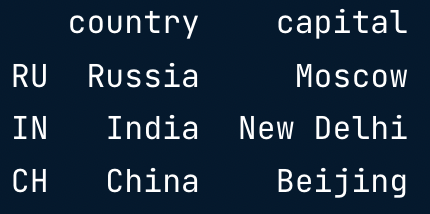
brics.loc[["RU", "IN", "CH"], ["country", "capital"]]
brics.loc[:, ["country", "capital"]]
Recap
- Square brackets
- Column access brics[["country", "capital"]]
- Row access: only through slicing brics[1:4]
- loc (label-based)
- Row access brics.loc[["RU", "IN", "CH"]]
- Column access brics.loc[:, ["country", "capital"]]
- Row & Column access
brics.loc [
["RU", "IN", "CH"],
["country", "capital"]
]
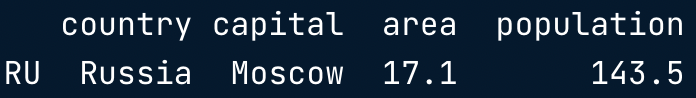
Row Access iloc
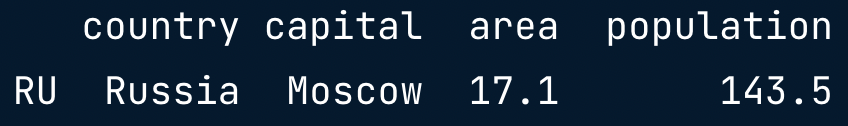
brics.loc[["RU"]]
brics.iloc[[1]]
brics.loc[["RU", "IN", "CH"]]
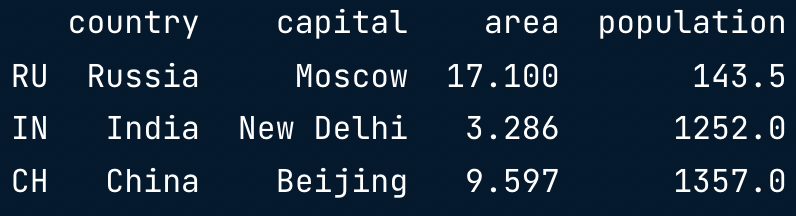
brics.iloc[[1,2,3]]
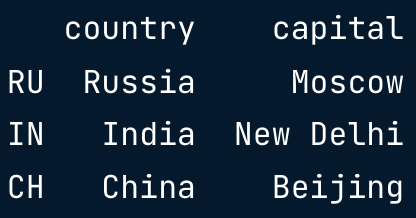
brics.loc[["RU", "IN", "CH"], ["country", "capital"]]
brics.iloc[[1,2,3], [0,1]]
brics.loc[:, ["country", "capital"]]
brics.iloc[:, [0,1]]
Let's practice!
Logic, Control Flow and Filtering
Comparison Operators

긴 글 읽어주셔서 감사합니다 :)
'Study > 가짜연구소: Data Scientist - Python' 카테고리의 다른 글
| [가짜연구소] Data Scientist - Python 6주차. (0) | 2022.10.22 |
|---|---|
| [가짜연구소] Data Scientist - Python 5주차. (2) | 2022.10.19 |
| [가짜연구소] Data Scientist - Python 4주차. (0) | 2022.10.09 |
| [가짜연구소] Data Scientist - Python 3주차. (0) | 2022.10.02 |
| [가짜연구소] Data Scientist - Python 1주차. (0) | 2022.09.17 |