
[CloudNet@] PKOS 스터디는 '24단계 실습으로 정복하는 쿠버네티스' 도서를 베이스로 진행됩니다!!
Related URL: https://www.yes24.com/Product/Goods/115187666
안녕하세요 늑대양입니다 😍

이번에 CloudNet@에서 진행하는 Production Kubernetes Online Study(PKOS)에 참여하여 관련 내용을 공유드리고자 합니다.
오늘은 PKOS 스터디 5주차 학습 내용을 안내해드리록하겠습니다.

CloudNet@ 팀 블로그 Main URL:
https://www.notion.so/gasidaseo/CloudNet-Blog-c9dfa44a27ff431dafdd2edacc8a1863
CloudNet@ Blog
CloudNet@ 팀에서 Cloud Infra & Network 기술에 대한 정보를 공유하는 블로그 입니다.
www.notion.so
Production Kubernetes Online Study - 5주차
5주차 학습 주제: 쿠버네티스 모니터링 (Prometheus, Grafana)
Index.
- 이론
- 실습 환경 배포 (c5.2xlarge, t3.small 타입 사용)
- 프로메테우스 (Prometheus)
- 그라파타 (Grafana)
- (실습 완료 후) 자원 삭제
- 과제
- 과제 1.프로메테우스-스택 설치 후 '공식 or 여러가지 대시보드'를 추가해보시고, 관련 스샷 올려주세요
- 과제 2. NGINX 파드를 배포 후 관련 metric 을 프로메테우스 웹에서 확인하고, 그라파나에 nginx 대시보드를 추가 후 확신하시고 관련 스샷 올려주세요
이론
실습 환경 배포 (c5.2xlarge, t3.small 타입 사용)
- 기존에 배포하던 방식으로 kops 배포 및 마스터노드 SSH 접속
- Master & Worker Node instance type: c5.2xlarge
- kops instance type: t3.small
# 마스터노드 SSH 접속
ssh -i ~/.ssh/<자신의 키페어>.pem ec2-user@$(aws cloudformation describe-stacks --stack-name <자신의 스택 이름> --query 'Stacks[*].Outputs[0].OutputValue' --output text)
- EC2 instance profiles 설정, AWS LoadBalancer 배포 및 ExternalDNS & Metrics-server 설치 및 배포
# EC2 instance profiles 에 IAM Policy 추가(attach)
aws iam attach-role-policy --policy-arn arn:aws:iam::$ACCOUNT_ID:policy/AWSLoadBalancerControllerIAMPolicy --role-name masters.$KOPS_CLUSTER_NAME
aws iam attach-role-policy --policy-arn arn:aws:iam::$ACCOUNT_ID:policy/AWSLoadBalancerControllerIAMPolicy --role-name nodes.$KOPS_CLUSTER_NAME
aws iam attach-role-policy --policy-arn arn:aws:iam::$ACCOUNT_ID:policy/AllowExternalDNSUpdates --role-name masters.$KOPS_CLUSTER_NAME
aws iam attach-role-policy --policy-arn arn:aws:iam::$ACCOUNT_ID:policy/AllowExternalDNSUpdates --role-name nodes.$KOPS_CLUSTER_NAME
# kOps 클러스터 편집 : 아래 내용 추가
# kubeproxy.metricsBindAddress 설정은 프로메테우스 kube-proxy 메트릭 수집을 위해서 설정 : 기본값 127.0.0.1 -> 수정 0.0.0.0 - 링크
kops edit cluster
-----
spec:
certManager:
enabled: true
awsLoadBalancerController:
enabled: true
externalDns:
provider: external-dns
metricsServer:
enabled: true
kubeProxy:
metricsBindAddress: 0.0.0.0
-----
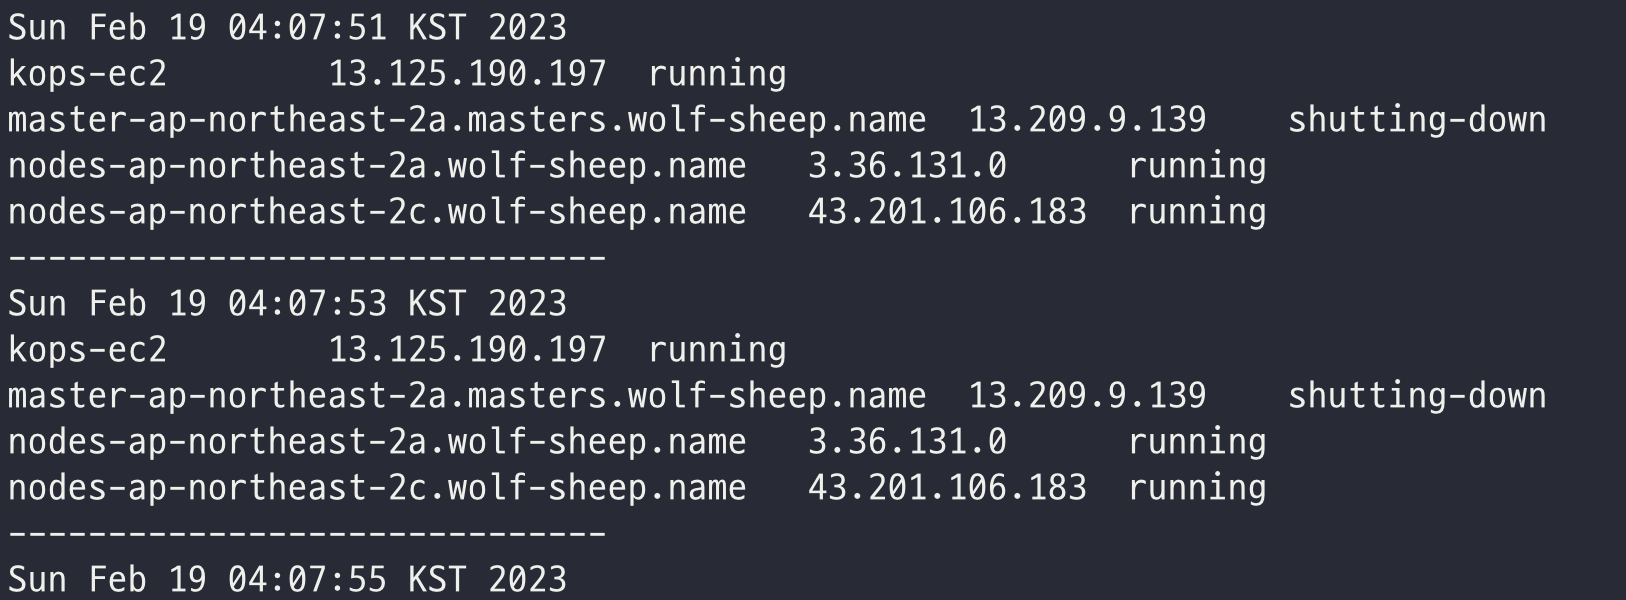
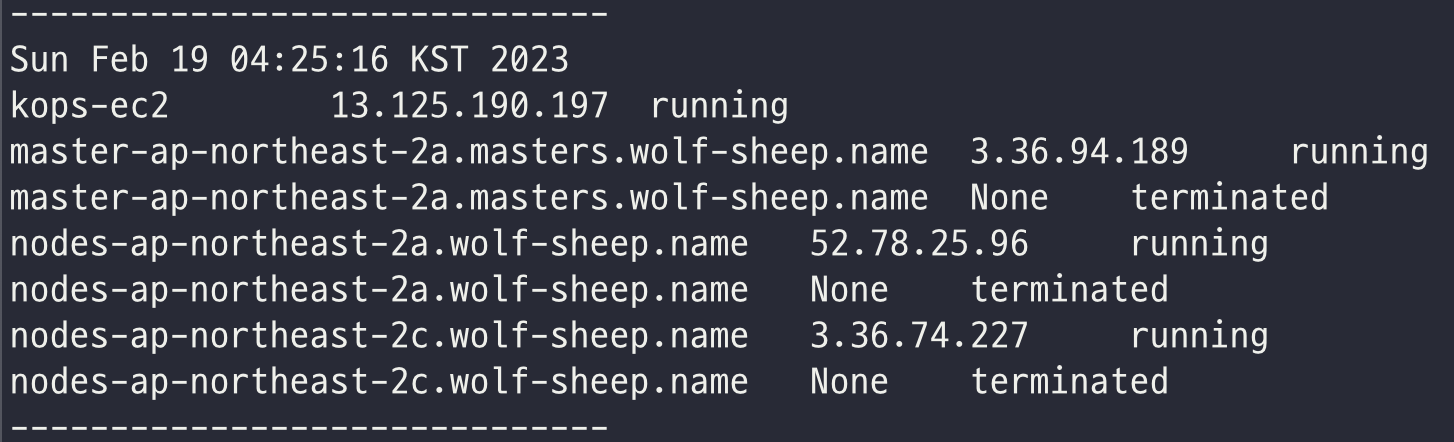
# 업데이트 적용 : 모든 노드 롤링업데이트 필요 >> 마스터 EC2인스턴스 삭제 후 재생성 후 정상 확인 후, 워커노드 EC2인스턴스 생성 후 Join 후 삭제 과정 진행됨
kops update cluster --yes && echo && sleep 3 && kops rolling-update cluster --yes
# EC2 인스턴스 모니터링
while true; do aws ec2 describe-instances --query "Reservations[*].Instances[*].{PublicIPAdd:PublicIpAddress,InstanceName:Tags[?Key=='Name']|[0].Value,Status:State.Name}" --output text | sort; echo "------------------------------" ;date; sleep 1; done

Metrics-server
- kubelet으로부터 수집한 리소스 메트릭을 수집 및 집계하는 클러스터 애드온 구성 요소
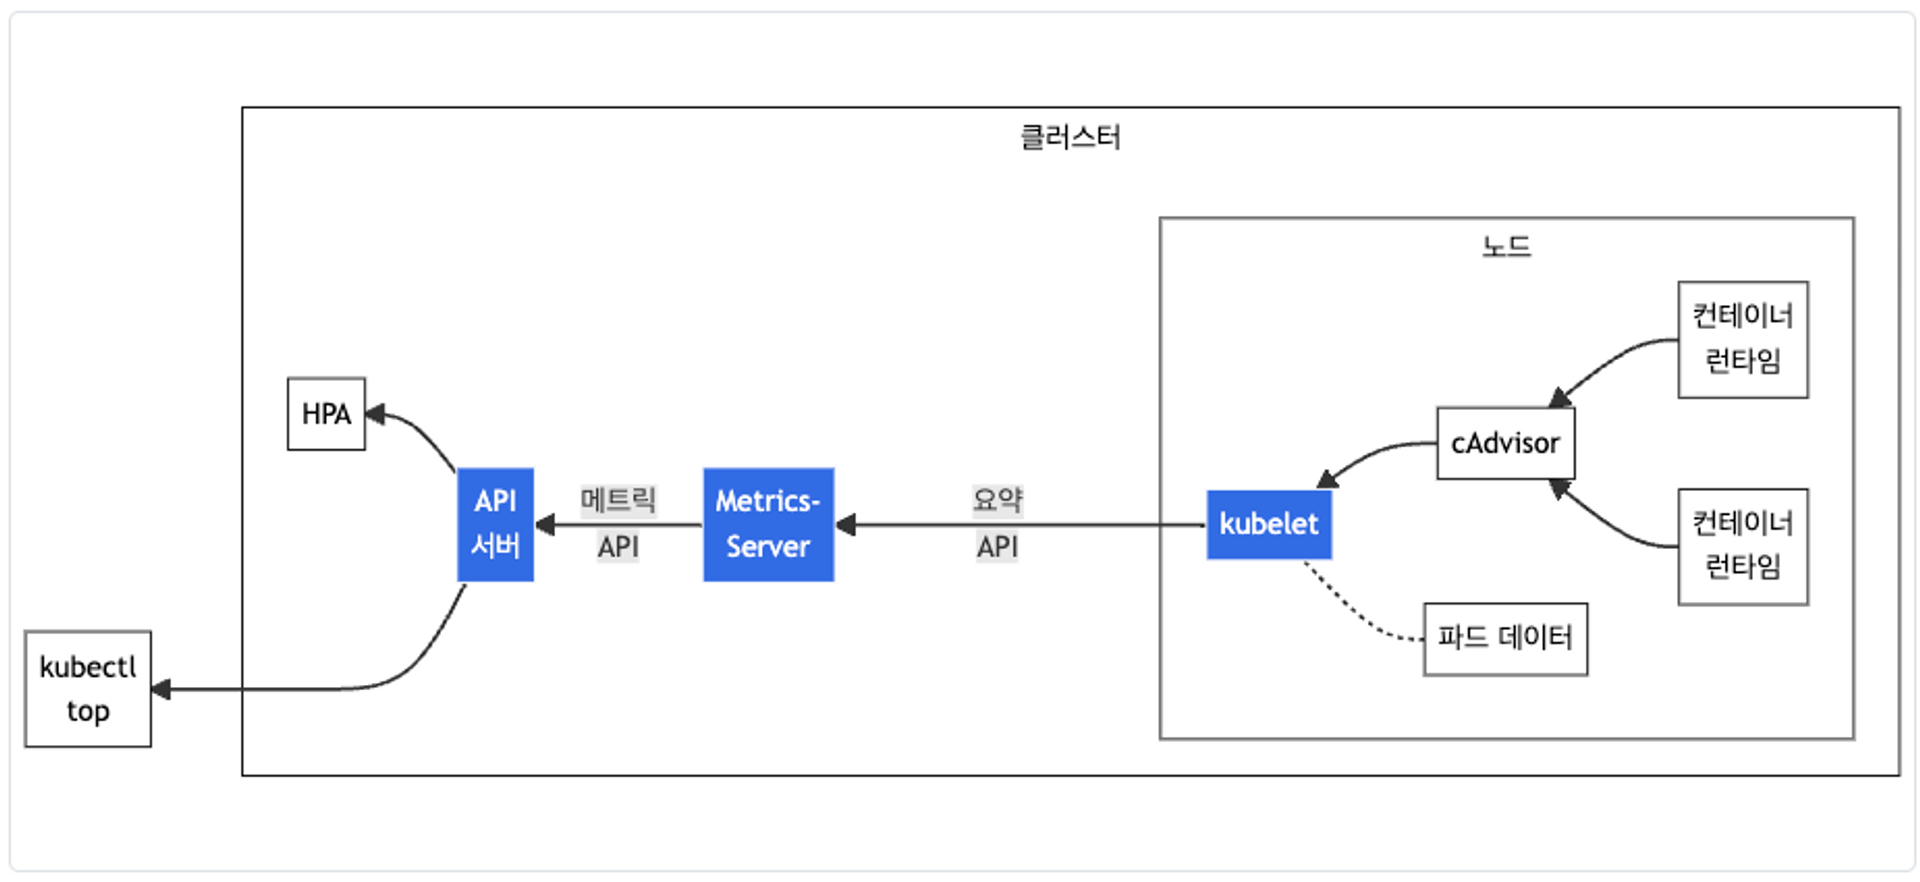
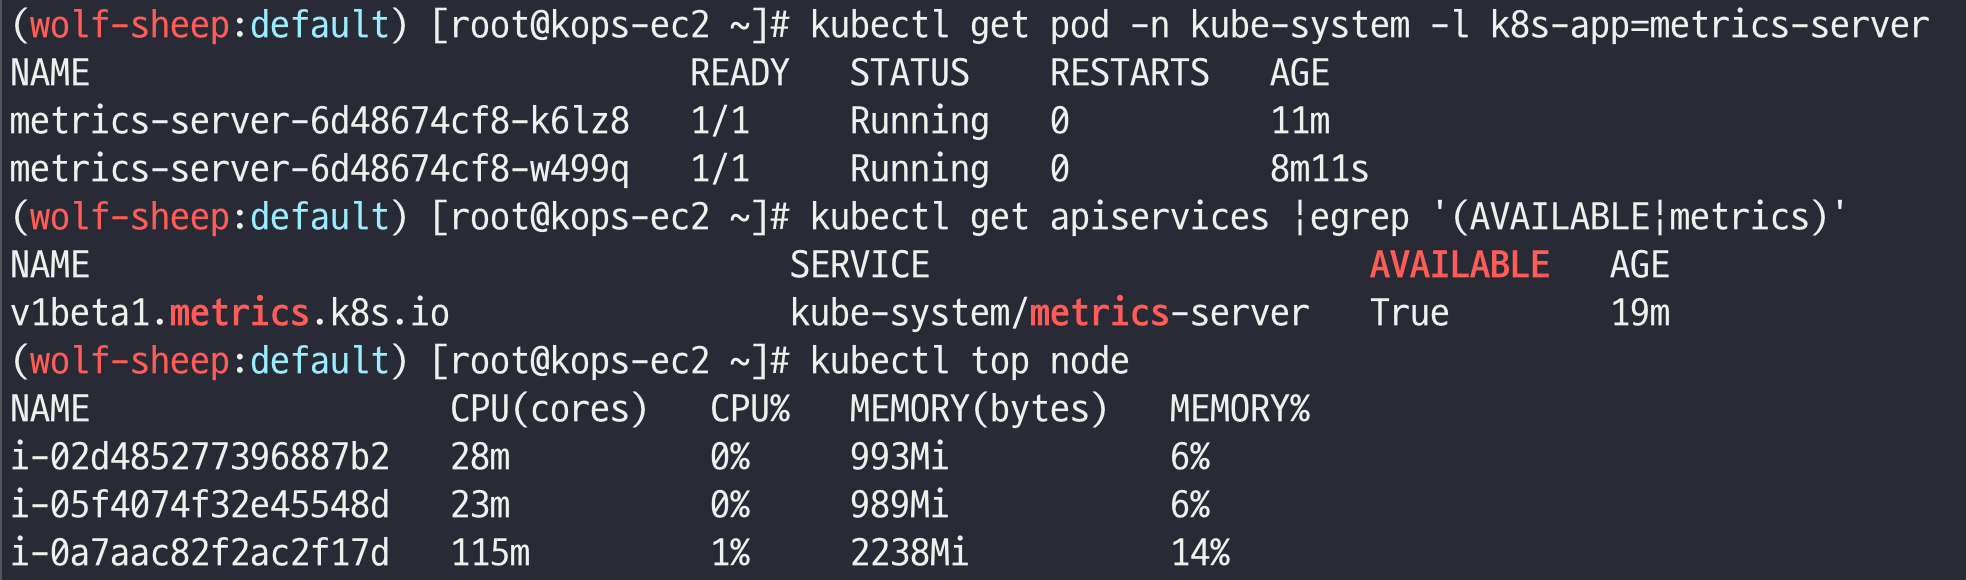
# 메트릭 서버 확인 : 메트릭은 15초 간격으로 cAdvisor를 통하여 가져옴
kubectl get pod -n kube-system -l k8s-app=metrics-server
kubectl get apiservices |egrep '(AVAILABLE|metrics)'


# 노드 메트릭 확인
kubectl top node


# 파드 메트릭 확인
kubectl top pod -A
kubectl top pod -n kube-system --sort-by='cpu'
kubectl top pod -n kube-system --sort-by='memory'
k9s
- 쿠버네티스 모니터링 도구 'k9s' 활용
- Main URL: https://k9scli.io/
K9s - Manage Your Kubernetes Clusters In Style
Who Let The Pods Out? K9s is a terminal based UI to interact with your Kubernetes clusters. The aim of this project is to make it easier to navigate, observe and manage your deployed applications in the wild. K9s continually watches Kubernetes for changes
k9scli.io
프로메테우스 (Prometheus)
Prometheus is an open-source systems monitoring and alerting toolkit originally built at SoundCloud
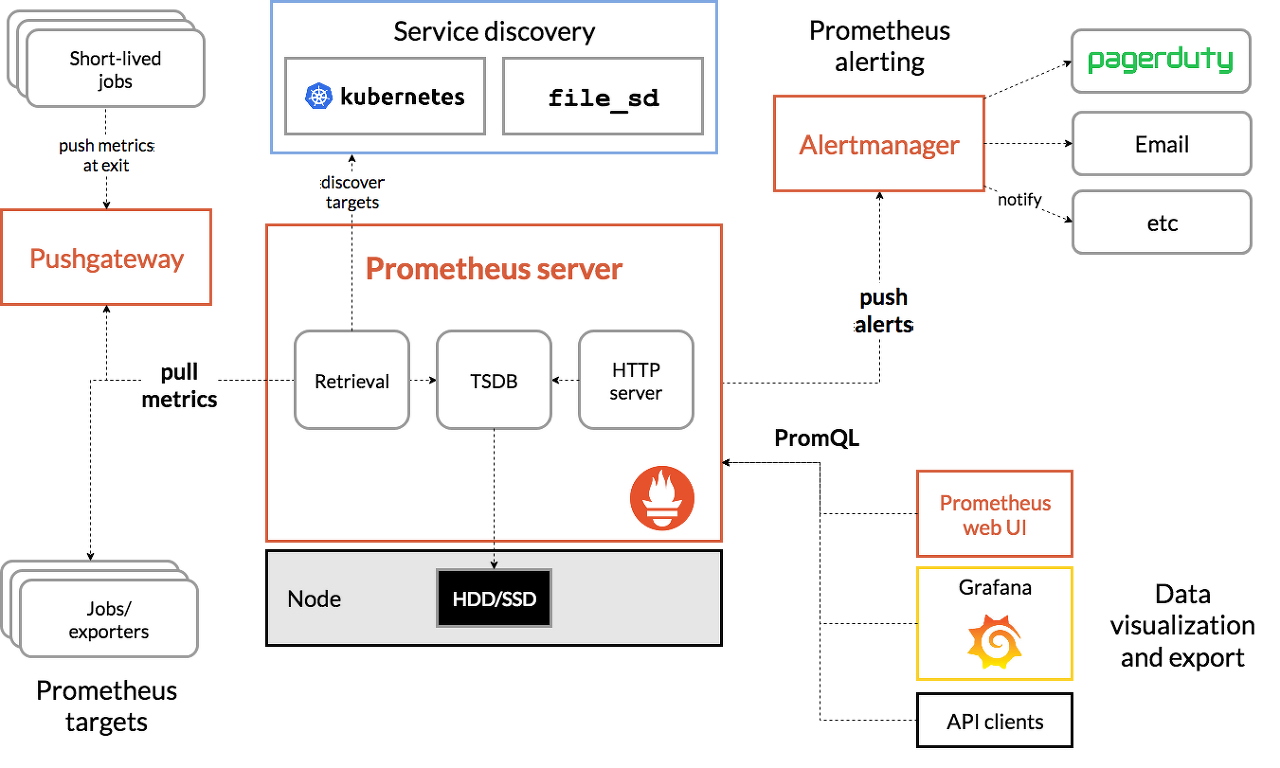
프로메테우스 제공 기능:
- 시계열 데이터를 스크래핑하고 저장하는 prometheus server
- 응용 프로그램 코드를 계측하기 위한 client library
- Short-lived jobs를 지원하기 위한 push gateway
- HAProxy, StatsD, Graphite 등과 같은 서비스를 위한 exporters
- 경보를 처리하는 alertmanager
- 다양한 지원 도구
프로메테우스-스택 설치
kube-prometheus-stack collects Kubernetes manifests, Grafana dashboards, and Prometheus rules combined with documentation and scripts to provide easy to operate end-to-end Kubernetes cluster monitoring with Prometheus using the Prometheus Operator.
- 모니터링에 필요한 여러 요소를 단일 차트(스택)으로 제공
- 시각화(그라파나)
- 이벤트 메시지 정책(경고 임계값, 수준) 등
# 모니터링
kubectl create ns monitoring
watch kubectl get pod,pvc,svc,ingress -n monitoring
# 사용 리전의 인증서 ARN 확인
CERT_ARN=`aws acm list-certificates --query 'CertificateSummaryList[].CertificateArn[]' --output text`
echo "alb.ingress.kubernetes.io/certificate-arn: $CERT_ARN"
# 설치
helm repo add prometheus-community https://prometheus-community.github.io/helm-charts
# 파라미터 파일 생성
cat <<EOT > ~/monitor-values.yaml
alertmanager:
ingress:
enabled: true
ingressClassName: alb
annotations:
alb.ingress.kubernetes.io/scheme: internet-facing
alb.ingress.kubernetes.io/target-type: ip
alb.ingress.kubernetes.io/listen-ports: '[{"HTTPS":443}, {"HTTP":80}]'
alb.ingress.kubernetes.io/certificate-arn: $CERT_ARN
alb.ingress.kubernetes.io/success-codes: 200-399
alb.ingress.kubernetes.io/group.name: "monitoring"
hosts:
- alertmanager.$KOPS_CLUSTER_NAME
paths:
- /*
grafana:
defaultDashboardsTimezone: Asia/Seoul
adminPassword: prom-operator
ingress:
enabled: true
ingressClassName: alb
annotations:
alb.ingress.kubernetes.io/scheme: internet-facing
alb.ingress.kubernetes.io/target-type: ip
alb.ingress.kubernetes.io/listen-ports: '[{"HTTPS":443}, {"HTTP":80}]'
alb.ingress.kubernetes.io/certificate-arn: $CERT_ARN
alb.ingress.kubernetes.io/success-codes: 200-399
alb.ingress.kubernetes.io/group.name: "monitoring"
hosts:
- grafana.$KOPS_CLUSTER_NAME
paths:
- /*
prometheus:
ingress:
enabled: true
ingressClassName: alb
annotations:
alb.ingress.kubernetes.io/scheme: internet-facing
alb.ingress.kubernetes.io/target-type: ip
alb.ingress.kubernetes.io/listen-ports: '[{"HTTPS":443}, {"HTTP":80}]'
alb.ingress.kubernetes.io/certificate-arn: $CERT_ARN
alb.ingress.kubernetes.io/success-codes: 200-399
alb.ingress.kubernetes.io/group.name: "monitoring"
hosts:
- prometheus.$KOPS_CLUSTER_NAME
paths:
- /*
prometheusSpec:
serviceMonitorSelectorNilUsesHelmValues: false
retention: 5d
retentionSize: "10GiB"
EOT
# 배포
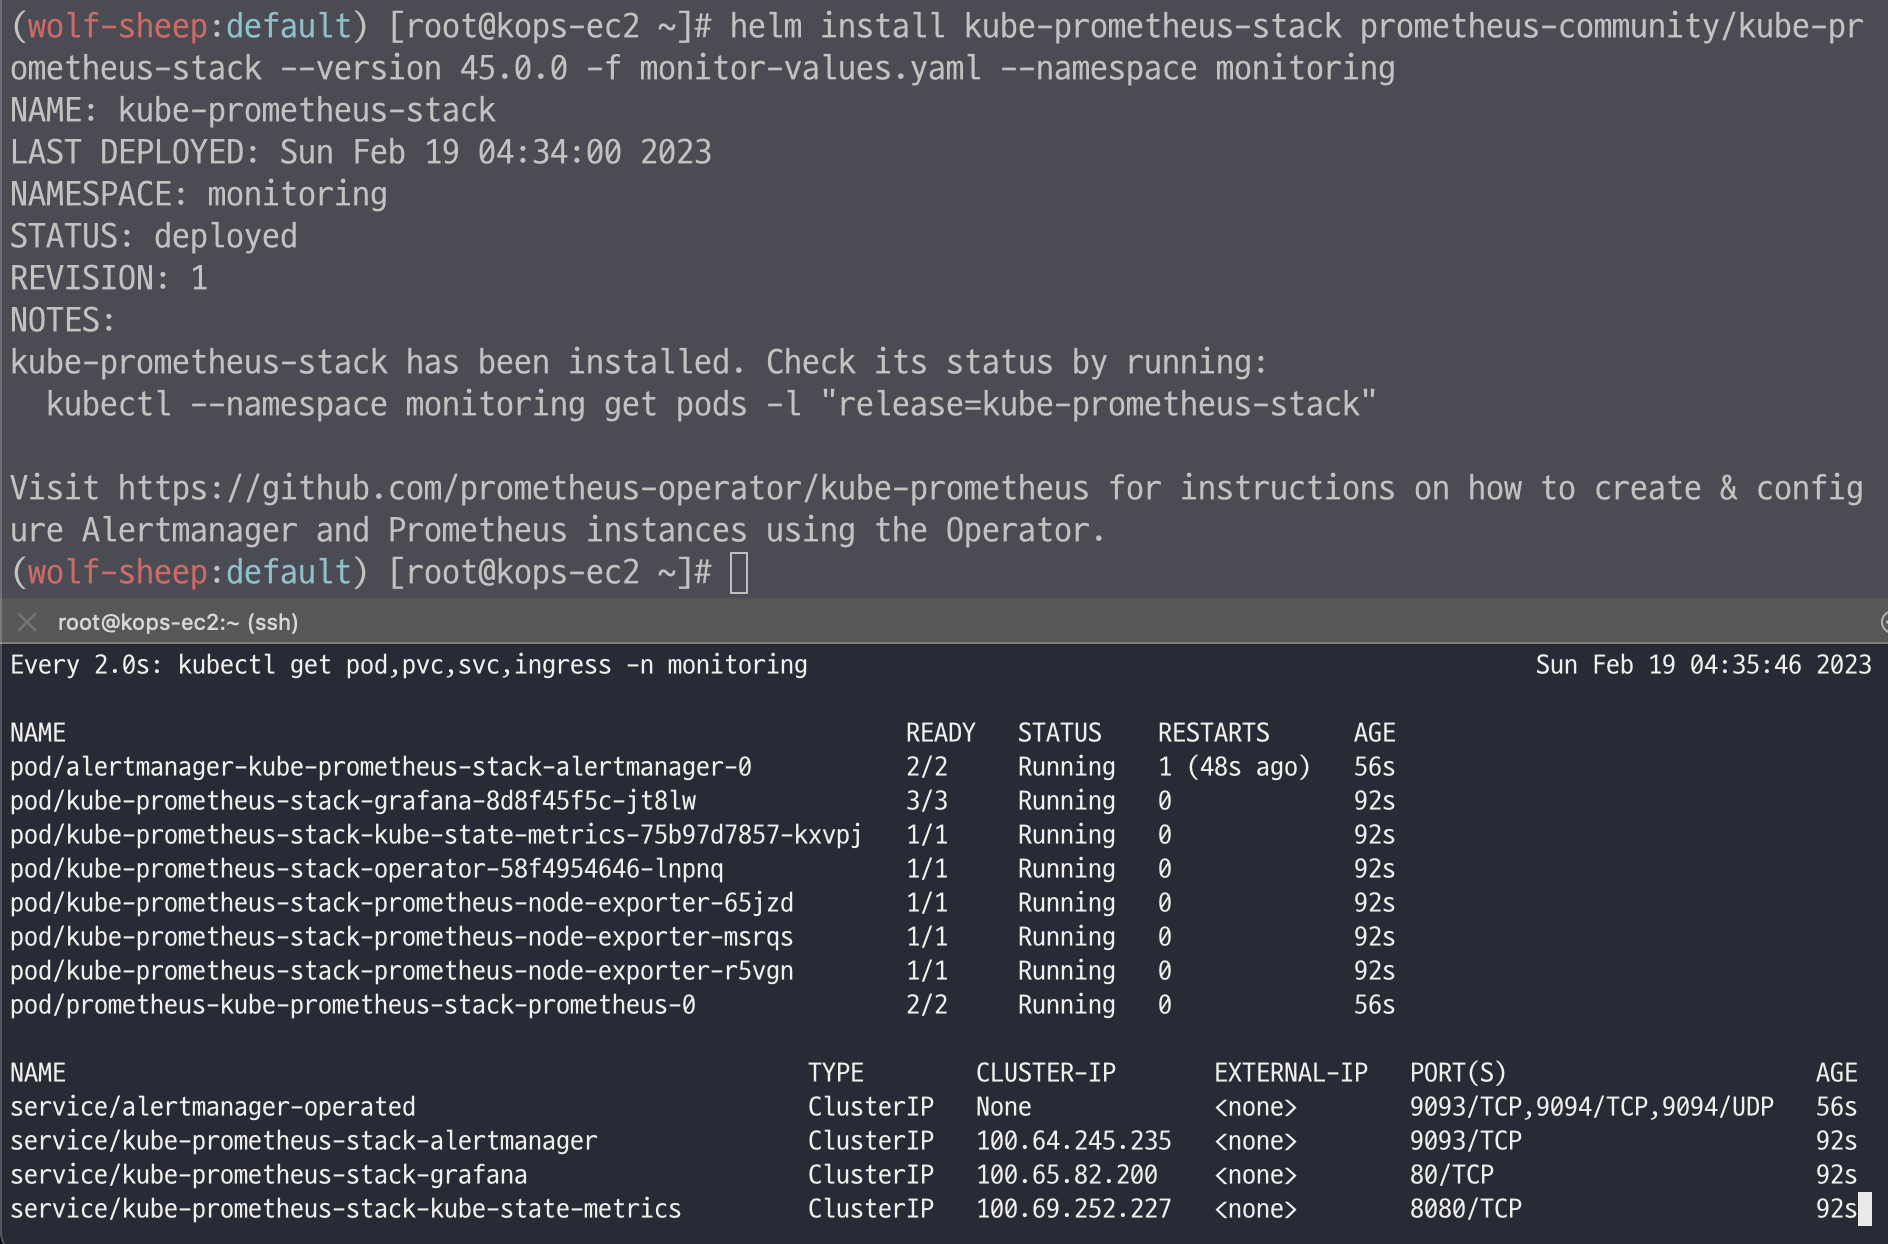
helm install kube-prometheus-stack prometheus-community/kube-prometheus-stack --version 45.0.0 -f monitor-values.yaml --namespace monitoring
# 확인
## alertmanager-0 : 사전에 정의한 정책 기반(예: 노드 다운, 파드 Pending 등)으로 시스템 경고 메시지를 생성 후 경보 채널(슬랙 등)로 전송
## grafana : 프로메테우스는 메트릭 정보를 저장하는 용도로 사용하며, 그라파나로 시각화 처리
## prometheus-0 : 모니터링 대상이 되는 파드는 ‘exporter’라는 별도의 사이드카 형식의 파드에서 모니터링 메트릭을 노출, pull 방식으로 가져와 내부의 시계열 데이터베이스에 저장
## node-exporter : 노드익스포터는 물리 노드에 대한 자원 사용량(네트워크, 스토리지 등 전체) 정보를 메트릭 형태로 변경하여 노출
## operator : 시스템 경고 메시지 정책(prometheus rule), 애플리케이션 모니터링 대상 추가 등의 작업을 편리하게 할수 있게 CRD 지원
## kube-state-metrics : 쿠버네티스의 클러스터의 상태(kube-state)를 메트릭으로 변환하는 파드
helm list -n monitoring
kubectl get pod,svc,ingress -n monitoring
kubectl get-all -n monitoring
kubectl get prometheus,alertmanager -n monitoring
kubectl get prometheusrule -n monitoring
kubectl get servicemonitors -n monitoring
프로메테우스-스택 삭제 프로세스:
# helm 삭제
helm uninstall -n monitoring kube-prometheus-stack


# crd 삭제
kubectl delete crd alertmanagerconfigs.monitoring.coreos.com
kubectl delete crd alertmanagers.monitoring.coreos.com
kubectl delete crd podmonitors.monitoring.coreos.com
kubectl delete crd probes.monitoring.coreos.com
kubectl delete crd prometheuses.monitoring.coreos.com
kubectl delete crd prometheusrules.monitoring.coreos.com
kubectl delete crd servicemonitors.monitoring.coreos.com
kubectl delete crd thanosrulers.monitoring.coreos.com
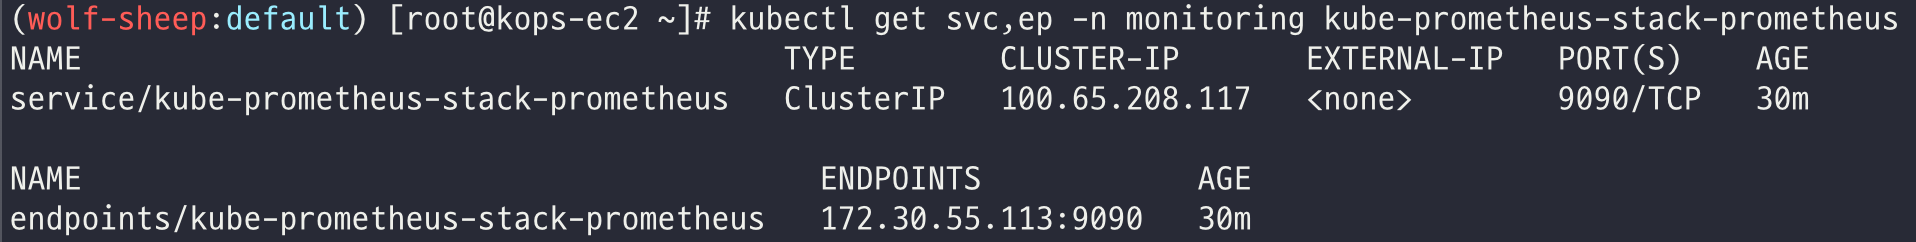
프로메테우스 기본 사용: 모니터링 그래프
- 모니터링 대상이 되는 서비스는 일반적으로 자체 웹 서버의 /metrics 엔드포인트 경로에 다양한 메트릭 정보를 노출
- 이후 프로메테우스는 해당 경로에 http get 방식으로 메트릭 정보를 가져와 TSDB 형식으로 저장
# 아래 처럼 프로메테우스가 각 서비스의 9100 접속하여 메트릭 정보를 수집
kubectl get node -owide
kubectl get svc,ep -n monitoring kube-prometheus-stack-prometheus-node-exporter


# 마스터노드에 lynx 설치
ssh -i ~/.ssh/id_rsa ubuntu@api.$KOPS_CLUSTER_NAME hostname
ssh -i ~/.ssh/id_rsa ubuntu@api.$KOPS_CLUSTER_NAME sudo apt install lynx -y


# 노드의 9100번의 /metrics 접속 시 다양한 메트릭 정보를 확인할수 있음 : 마스터 이외에 워커노드도 확인 가능
ssh -i ~/.ssh/id_rsa ubuntu@api.$KOPS_CLUSTER_NAME lynx -dump localhost:9100/metrics
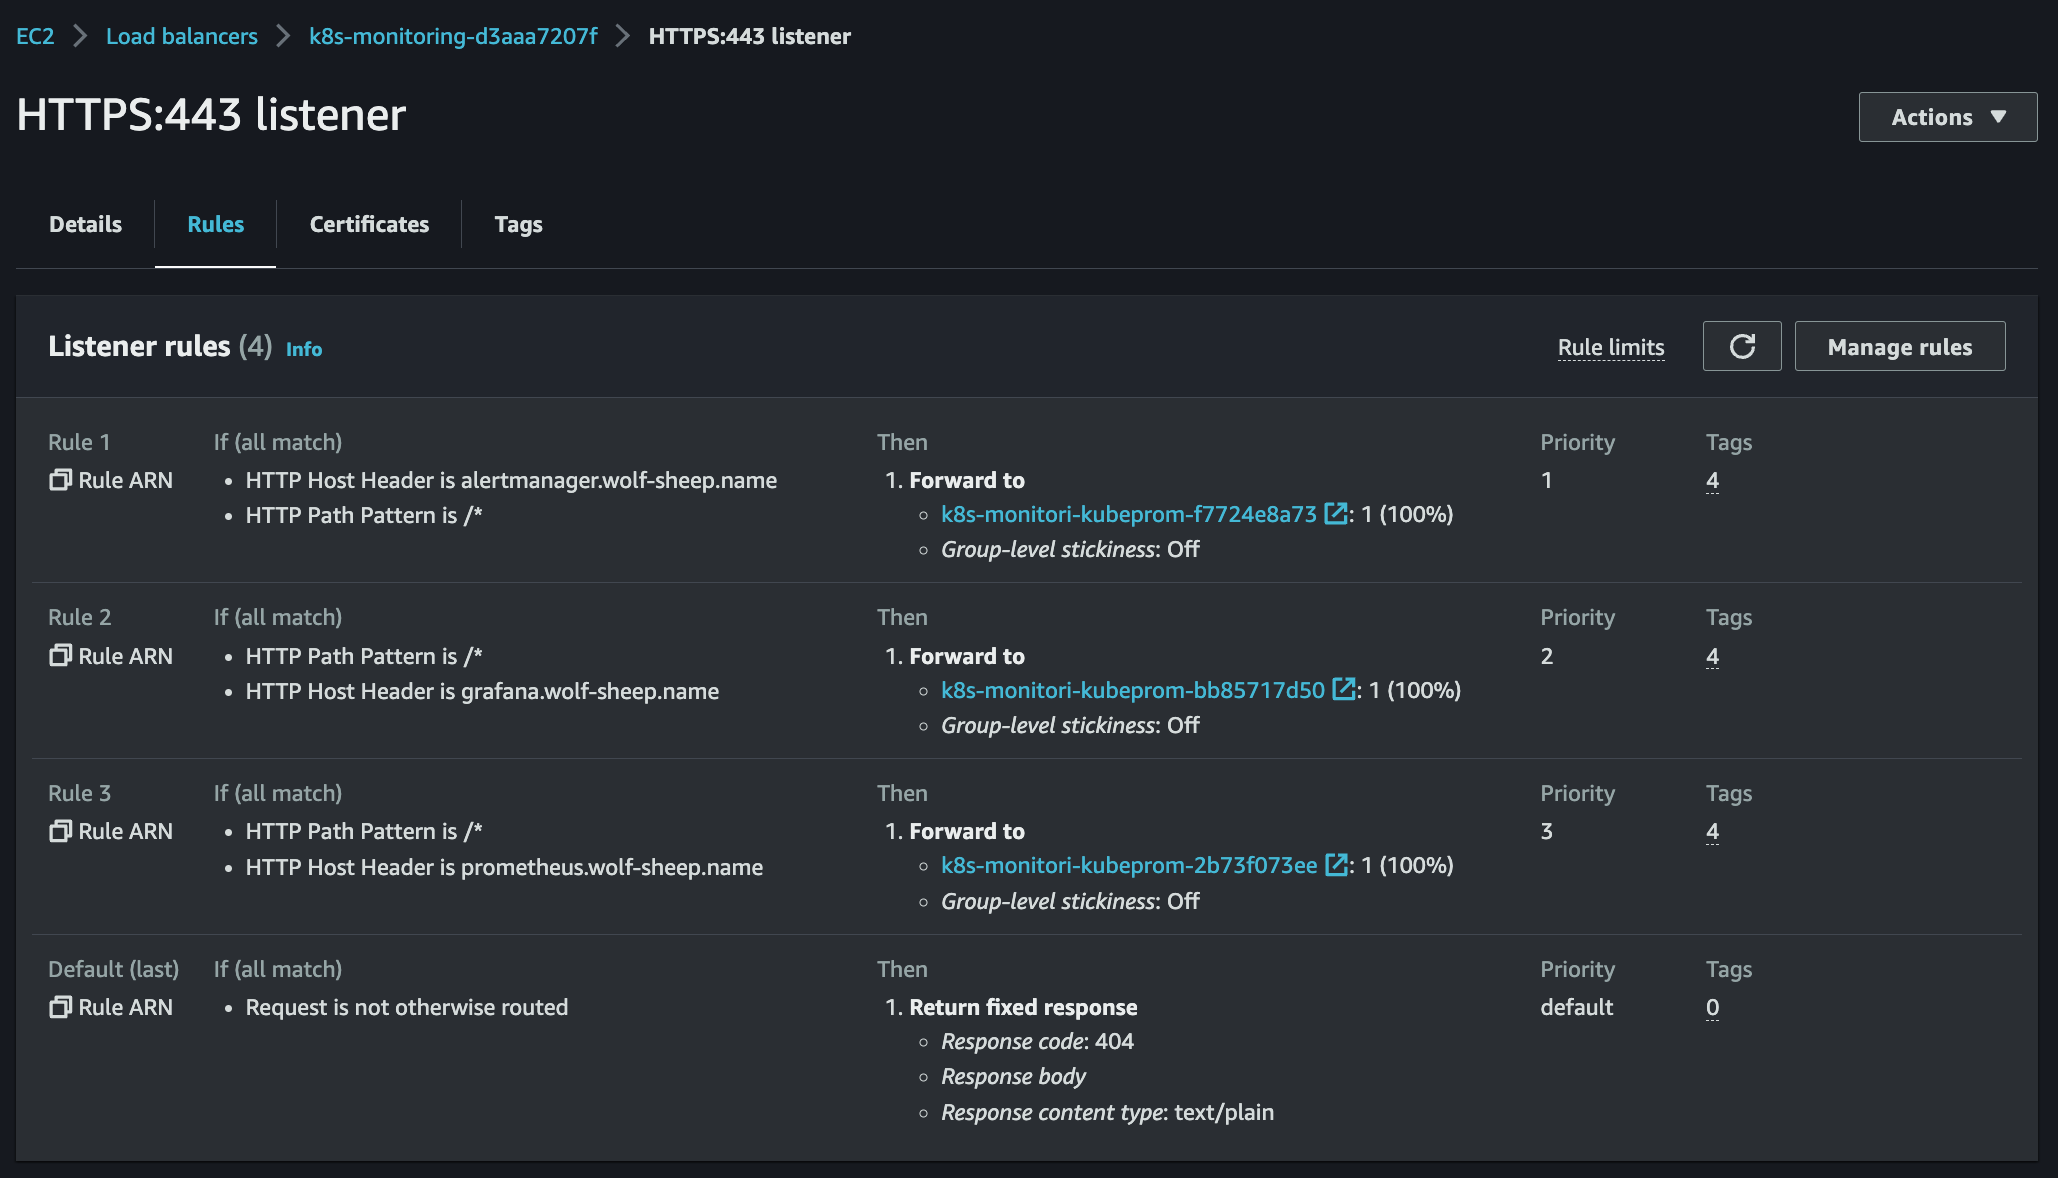
프로메테우스 ingress 도메인으로 웹 접속
# ingress 확인
kubectl get ingress -n monitoring kube-prometheus-stack-prometheus
kubectl describe ingress -n monitoring kube-prometheus-stack-prometheus
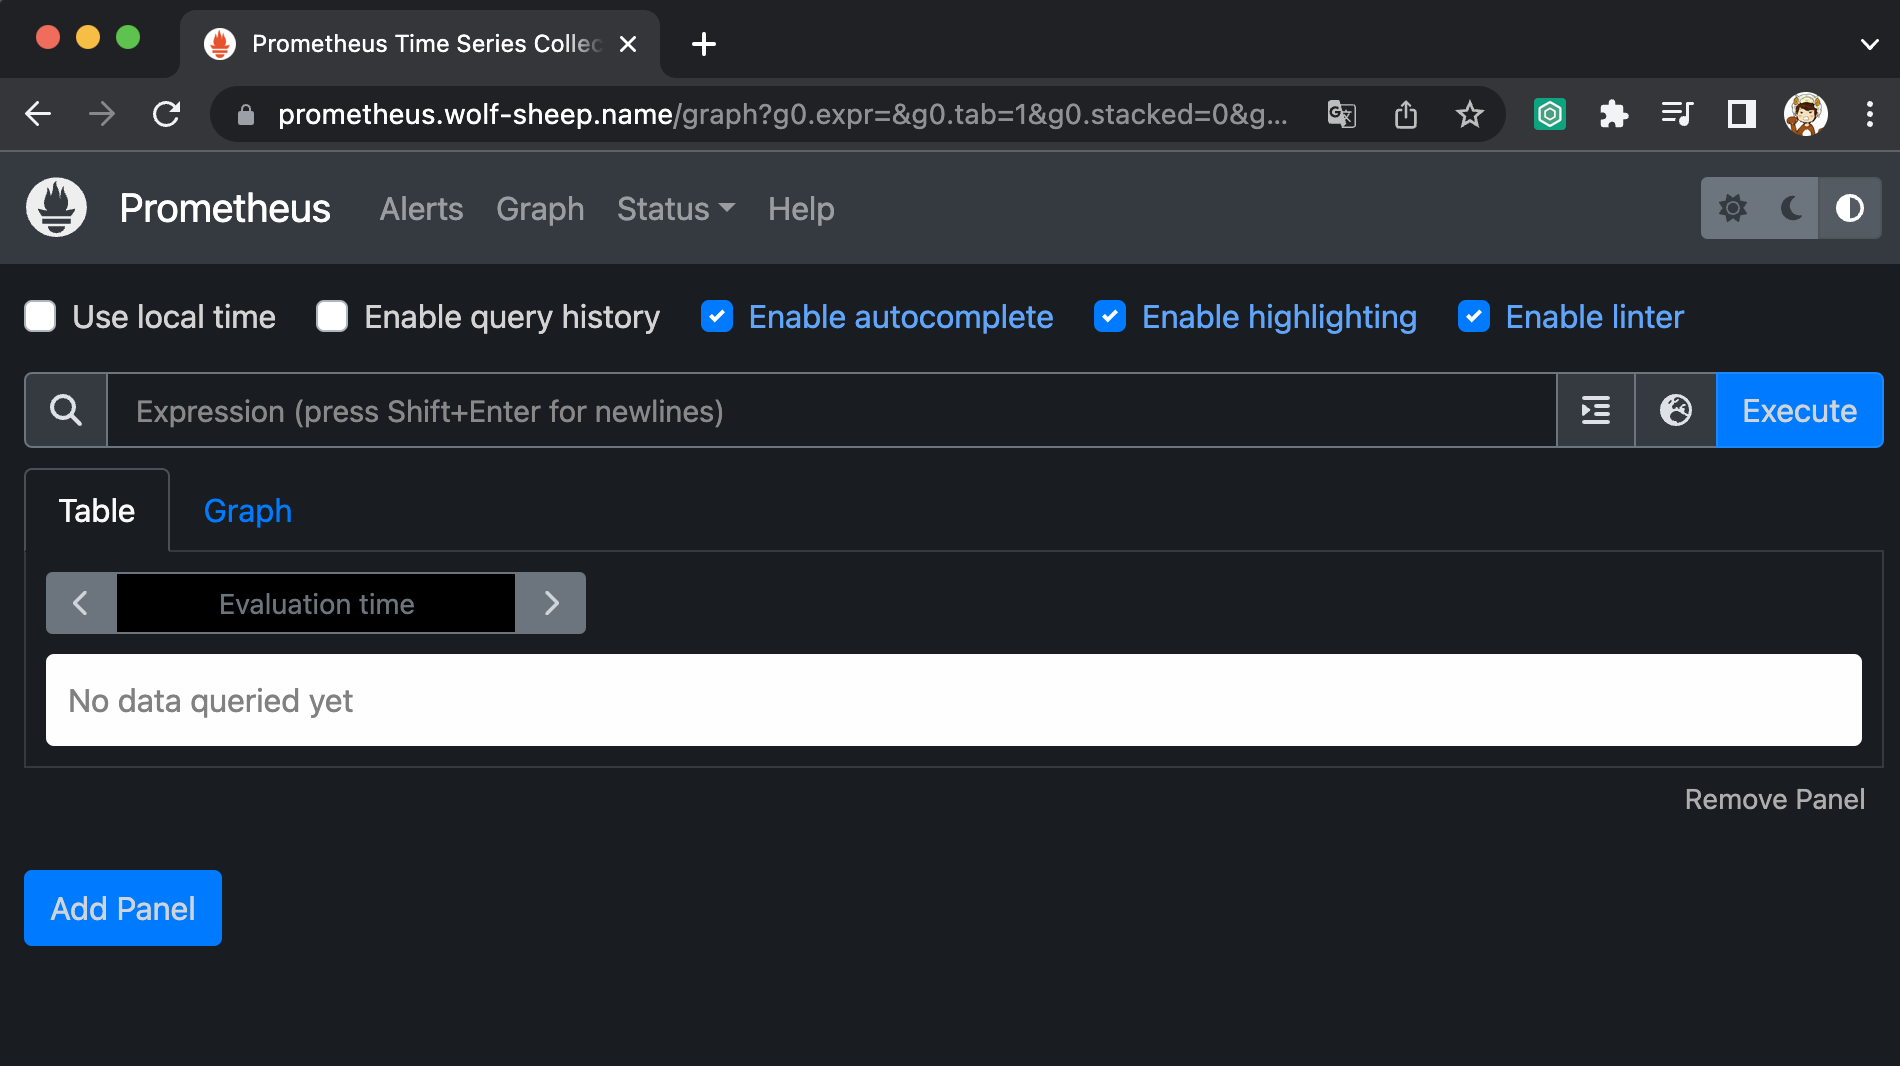
# 프로메테우스 ingress 도메인으로 웹 접속
echo -e "Prometheus Web URL = https://prometheus.$KOPS_CLUSTER_NAME"
# 웹 상단 주요 메뉴 설명
1. 경고(Alert) : 사전에 정의한 시스템 경고 정책(Prometheus Rules)에 대한 상황
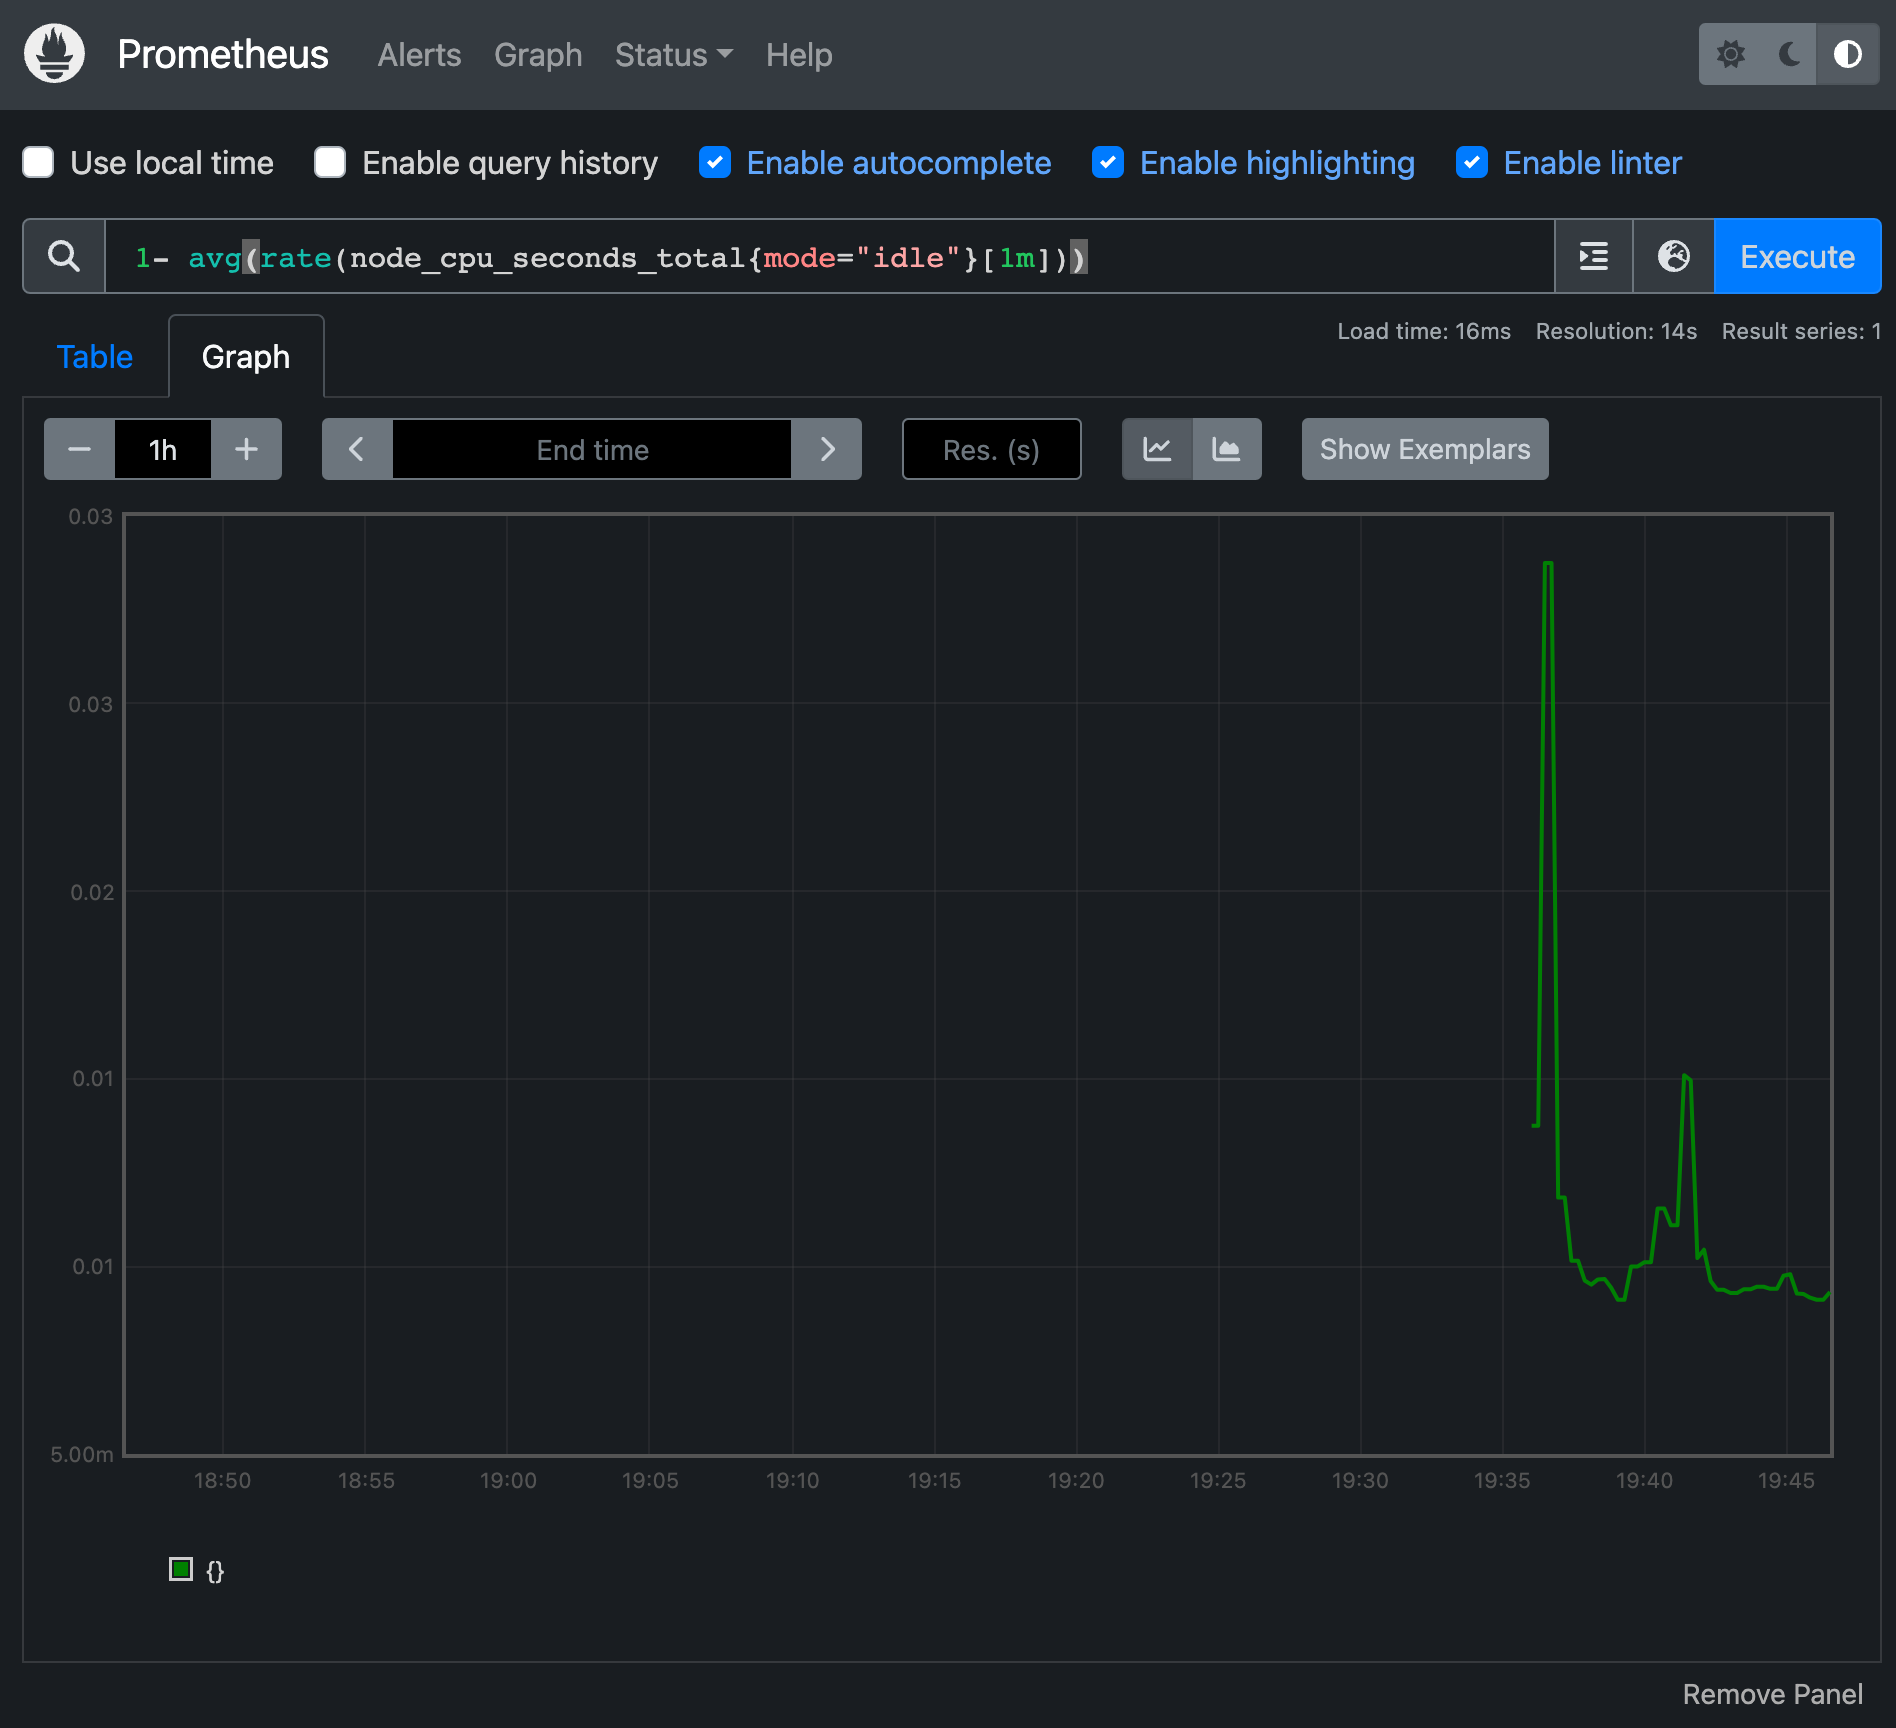
2. 그래프(Graph) : 프로메테우스 자체 검색 언어 PromQL을 이용하여 메트릭 정보를 조회 -> 단순한 그래프 형태 조회
3. 상태(Status) : 경고 메시지 정책(Rules), 모니터링 대상(Targets) 등 다양한 프로메테우스 설정 내역을 확인
4. 도움말(Help)

그라파나 (Grafana)
Grafana open source software enables you to query, visualize, alert on, and explore your metrics, logs, and traces wherever they are stored. Grafana OSS provides you with tools to turn your time-series database (TSDB) data into insightful graphs and visualizations.
- Grafana main URL: https://grafana.com/
Grafana: The open observability platform | Grafana Labs
Your observability stack Operational dashboards for your data here, there, or anywhere
grafana.com
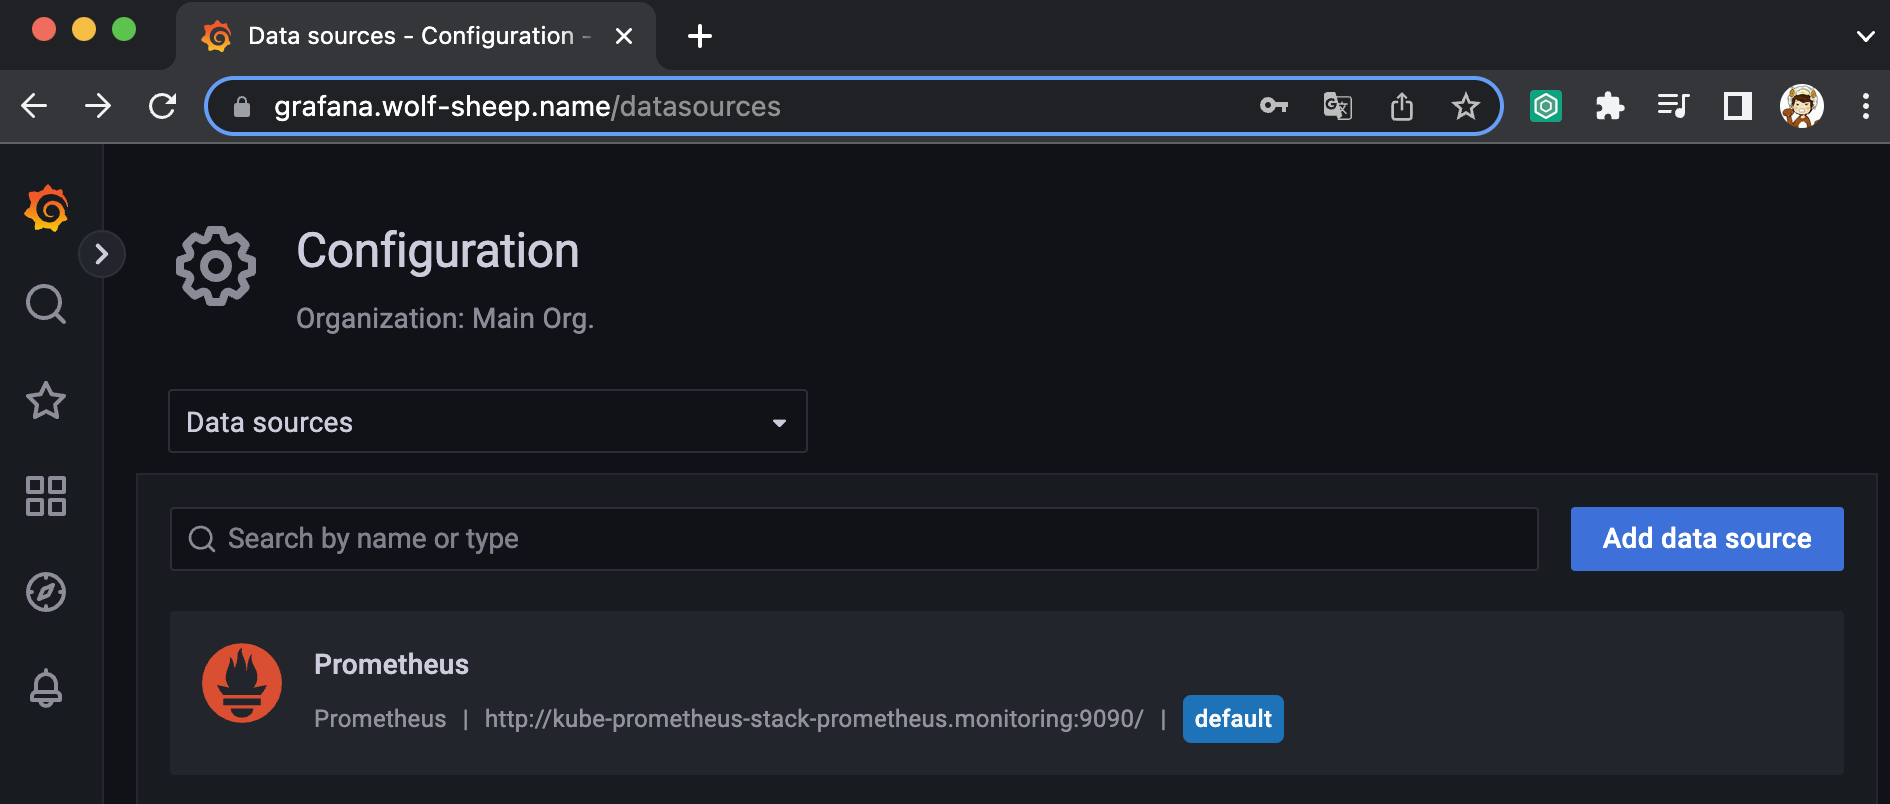
- TSDB 데이터를 시각화, 다양한 데이터 형식 지원(메트릭, 로그, 트레이스 등)
- 그라파나는 시각화 솔루션으로 데이터 자체를 저장하지 않음 → 현재 실습 환경에서는 데이터 소스는 프로메테우스를 사용
- 접속 정보 확인 및 로그인 : 기본 계정 - admin / prom-operator
# ingress 확인
kubectl get ingress -n monitoring kube-prometheus-stack-grafana
kubectl describe ingress -n monitoring kube-prometheus-stack-grafana


# ingress 도메인으로 웹 접속
echo -e "Grafana Web URL = https://grafana.$KOPS_CLUSTER_NAME"


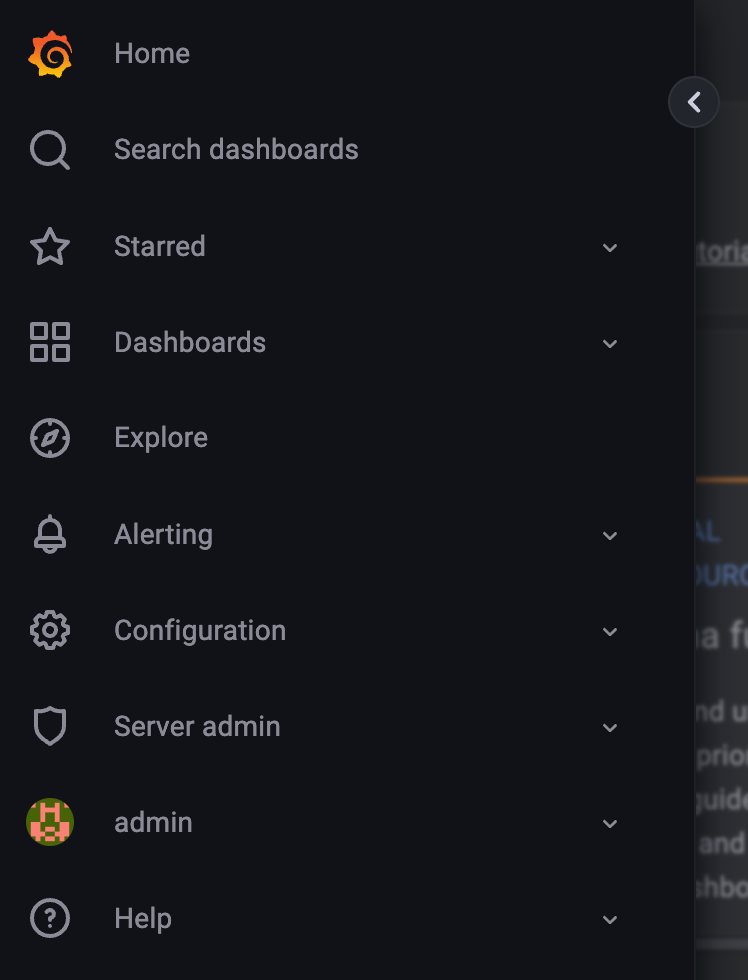
- Search dashboards : 대시보드 검색
- Starred : 즐겨찾기 대시보드
- Dashboards : 대시보드 전체 목록 확인
- Explore : 쿼리 언어 PromQL를 이용해 메트릭 정보를 그래프 형태로 탐색
- Alerting : 경고, 에러 발생 시 사용자에게 경고를 전달
- Configuration : 설정, 예) 데이터 소스 설정 등
- Server admin : 사용자, 조직, 플러그인 등 설정
- admin : admin 사용자의 개인 설정
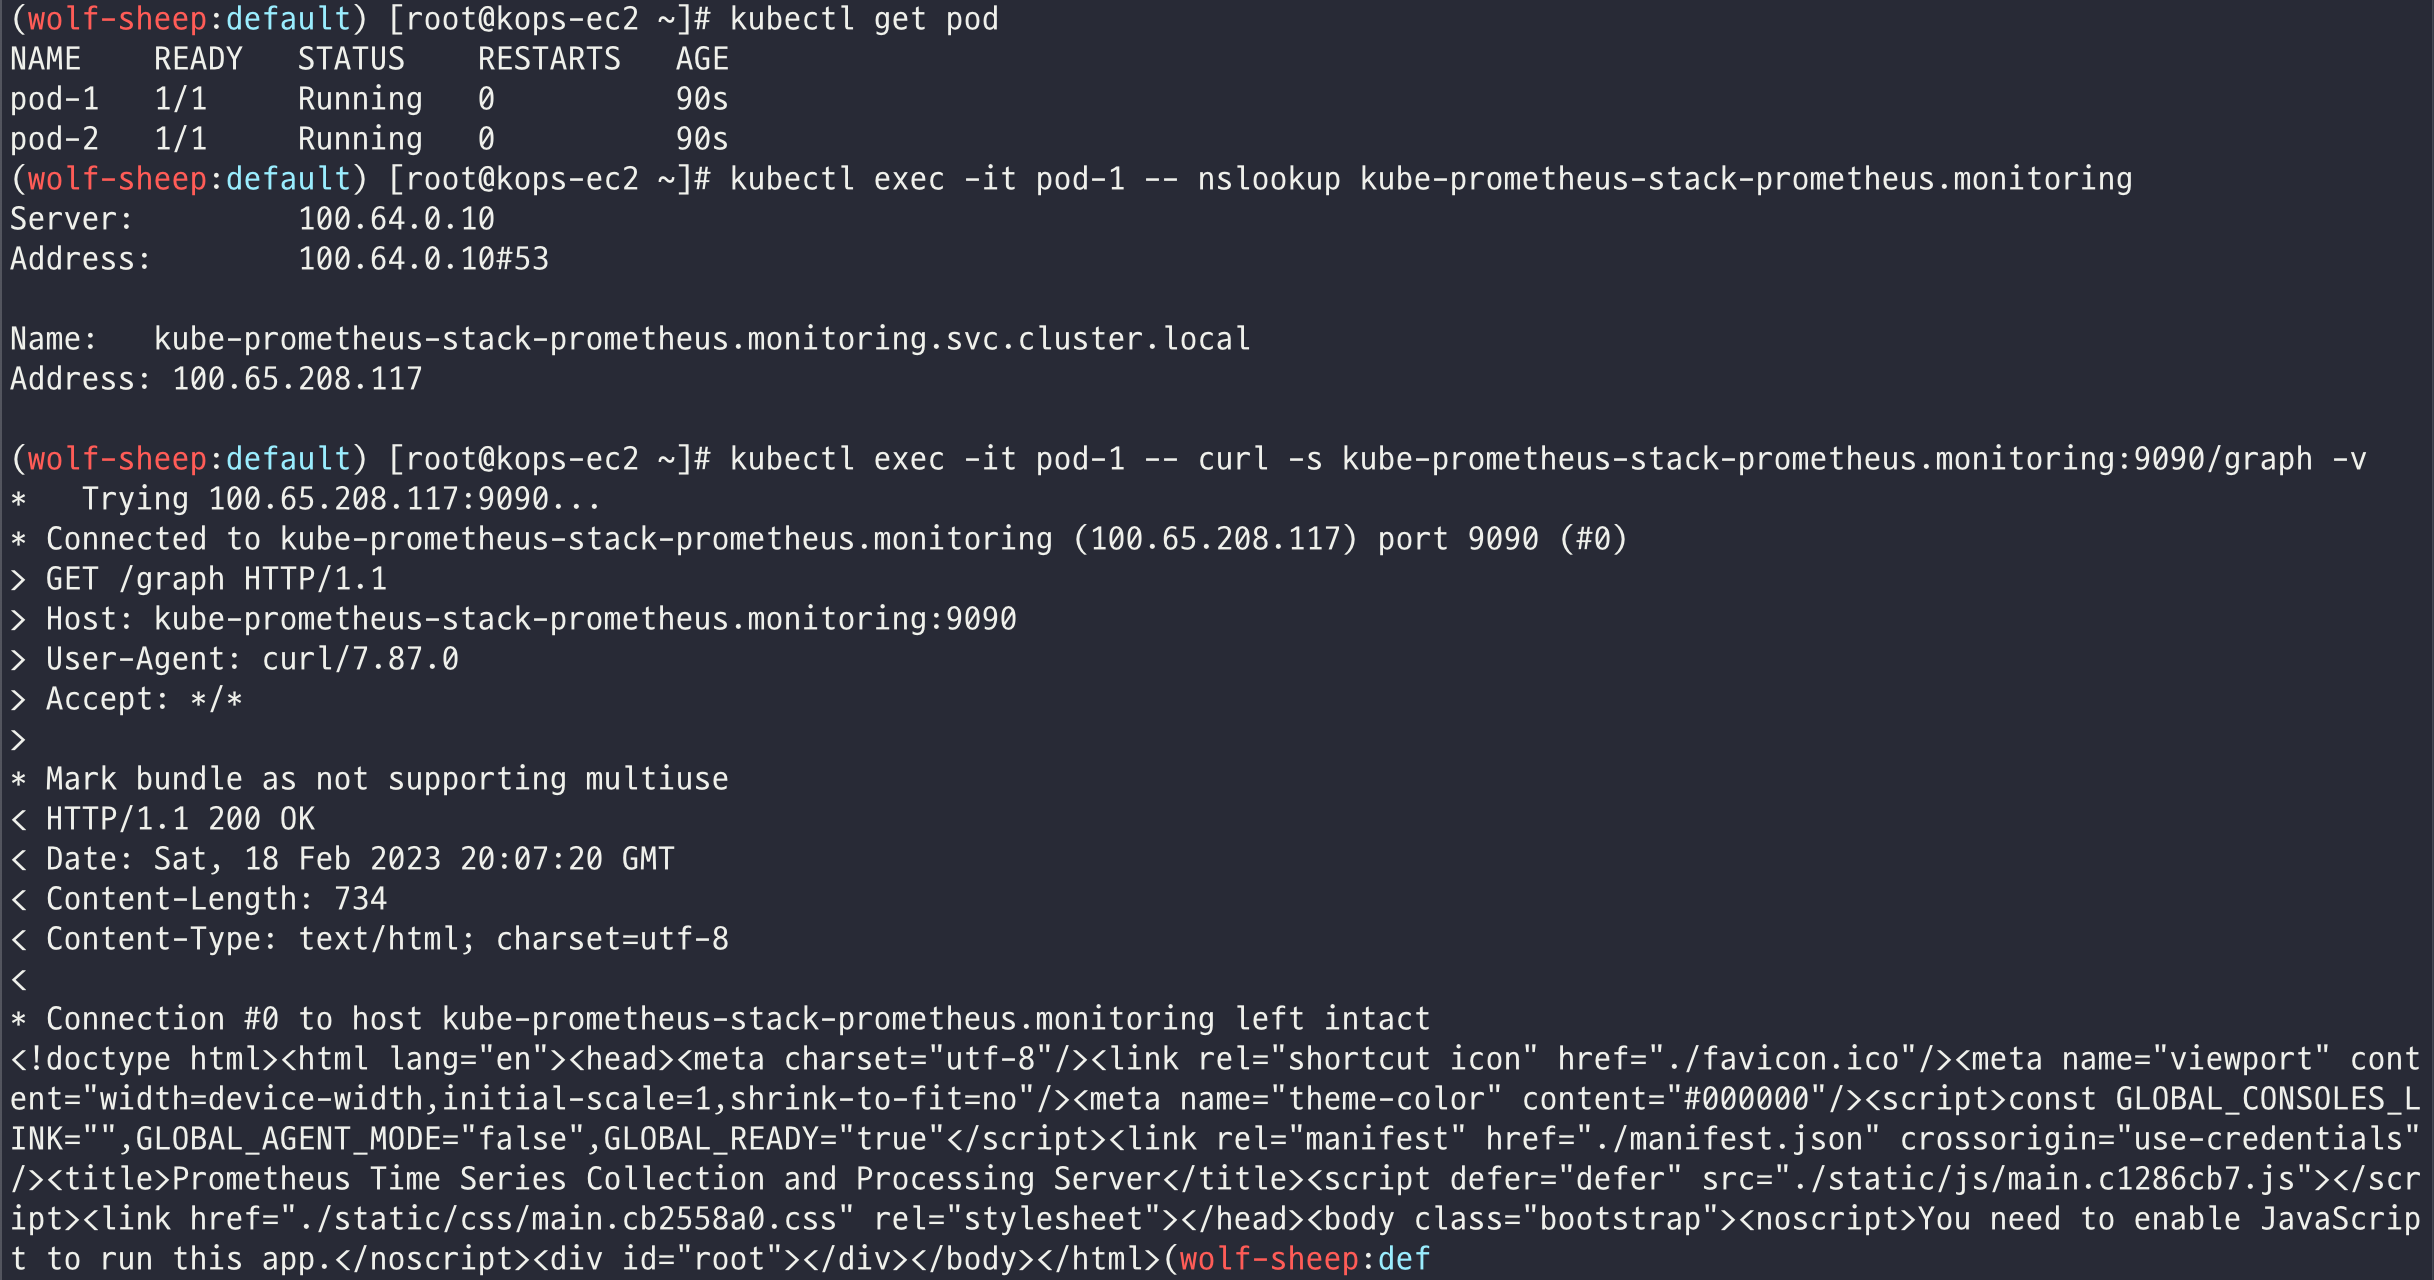
데이터 소스 테스트
# 테스트용 파드 배포
kubectl apply -f ~/pkos/2/netshoot-2pods.yaml
kubectl get pod

# 접속 확인
kubectl exec -it pod-1 -- nslookup kube-prometheus-stack-prometheus.monitoring
kubectl exec -it pod-1 -- curl -s kube-prometheus-stack-prometheus.monitoring:9090/graph -v
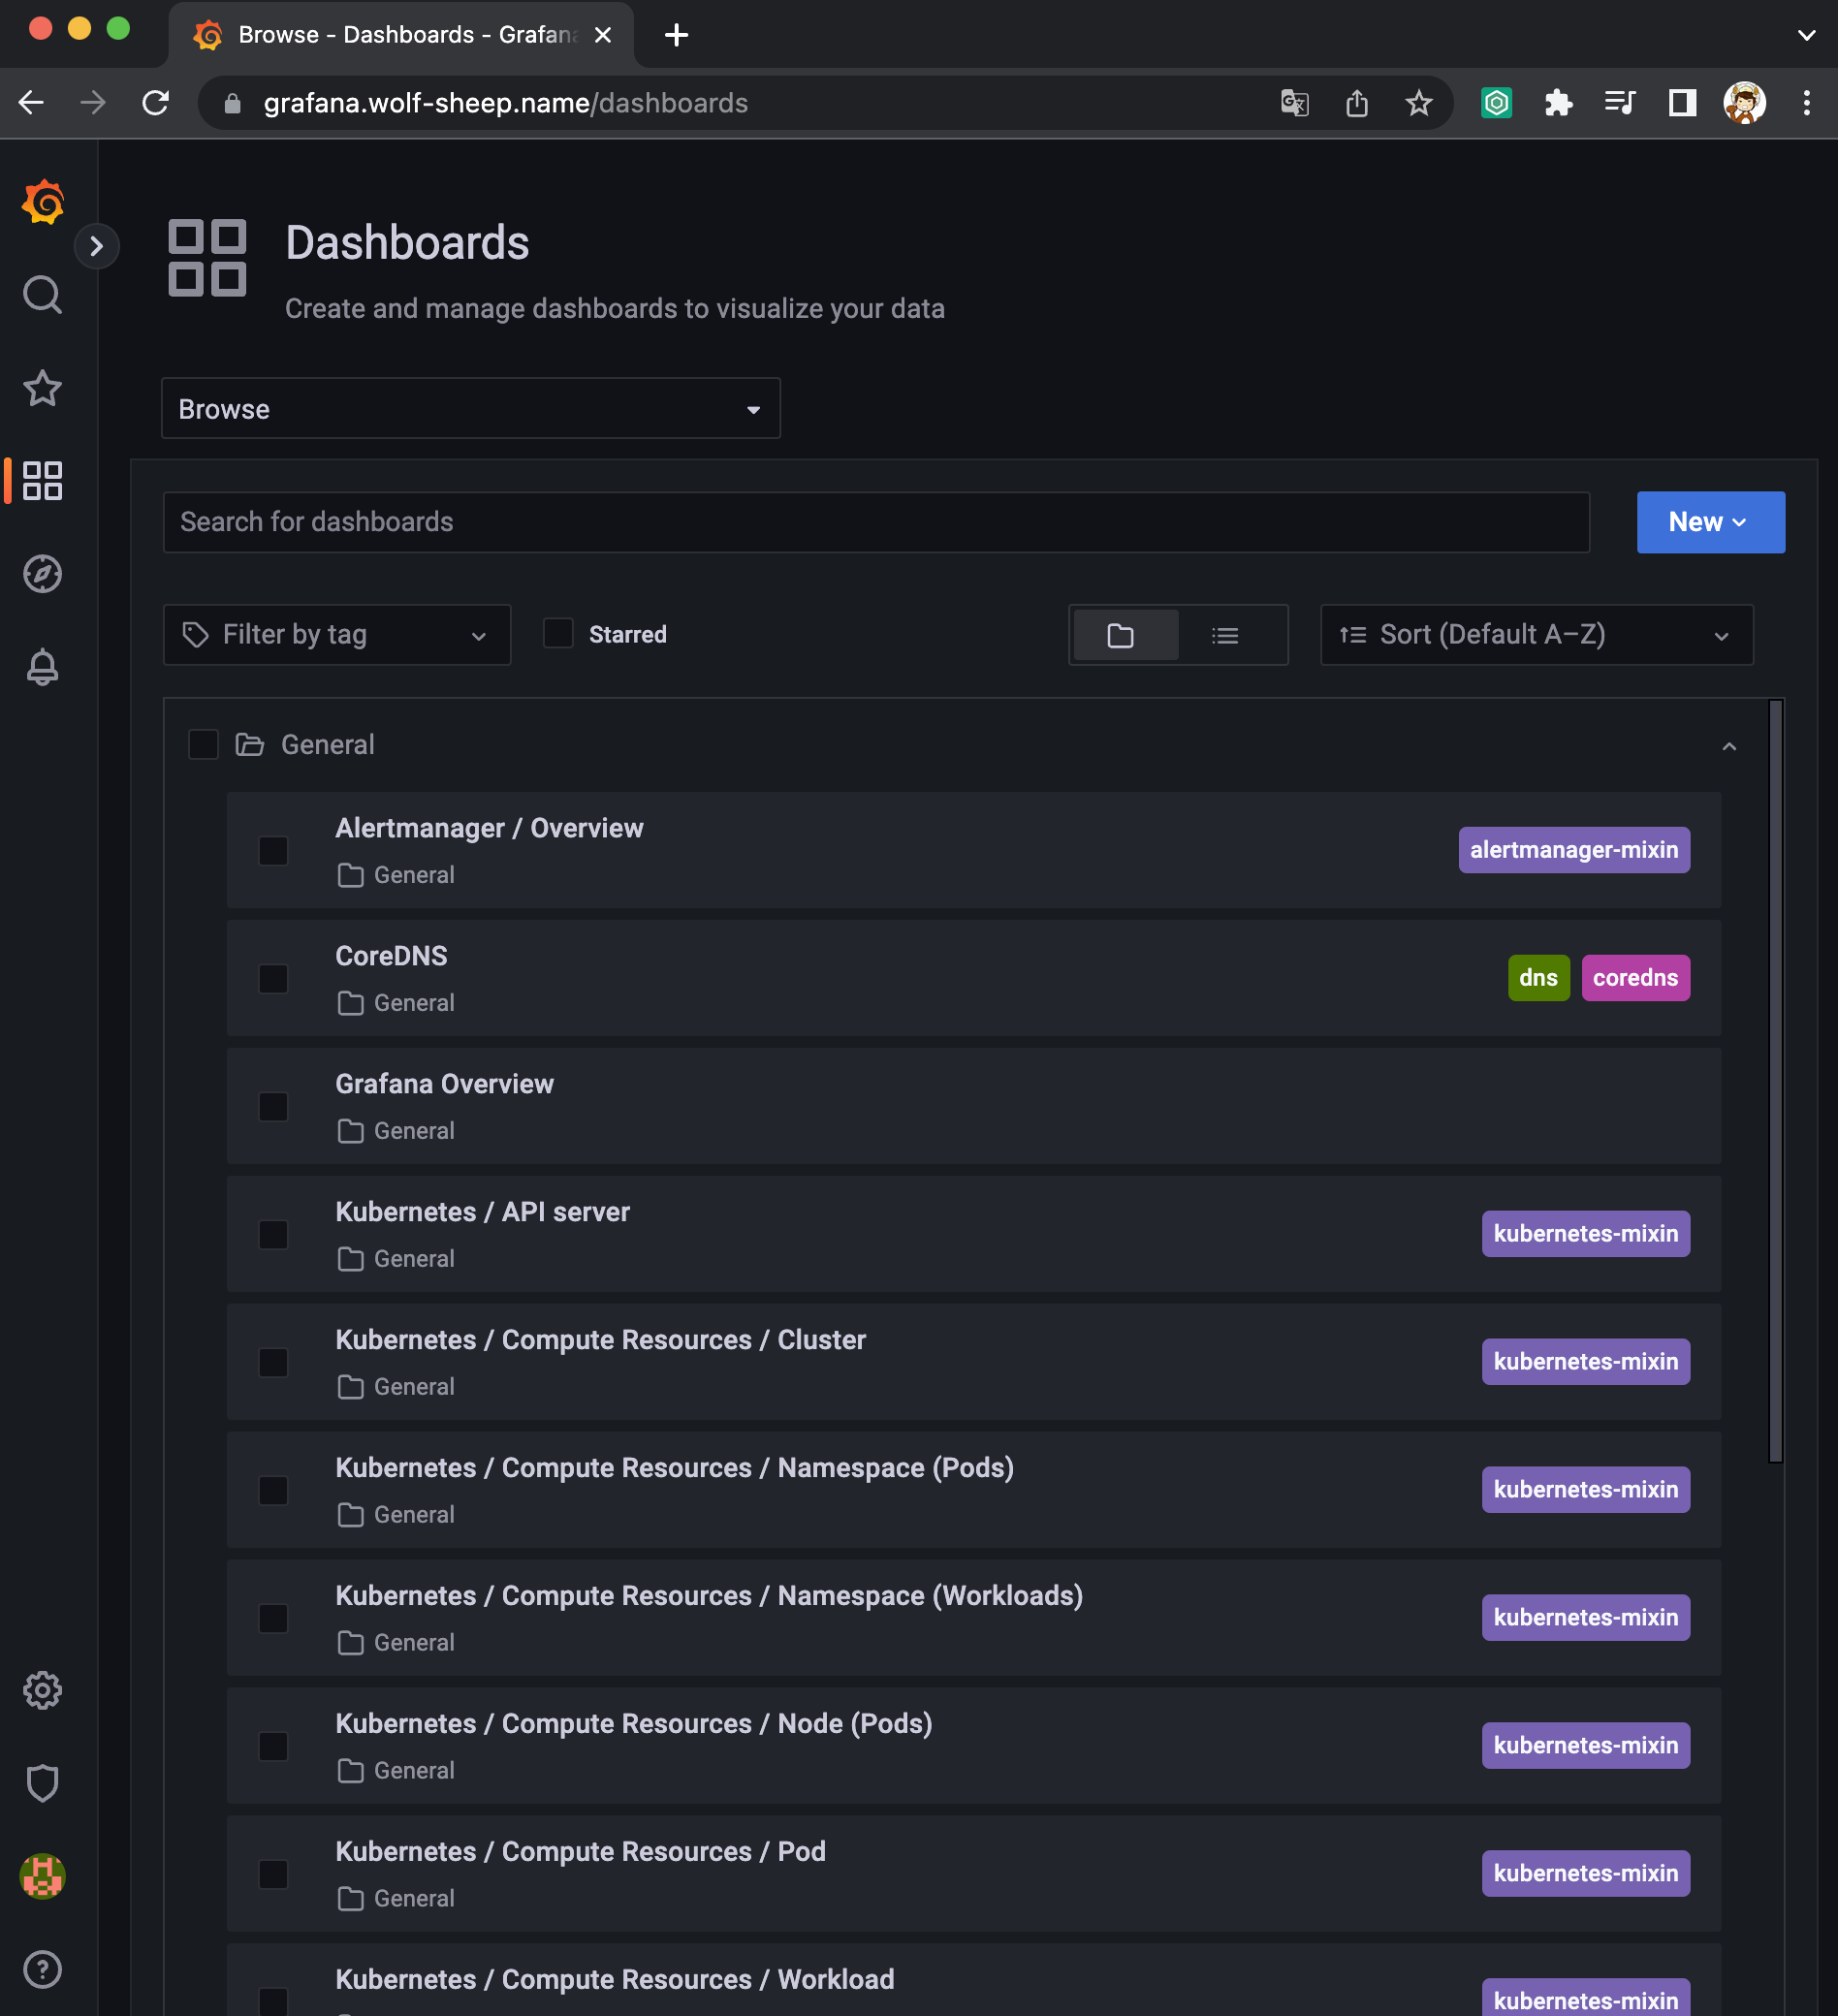
대시보드 사용:
기본 대시보드
- 스택을 통해서 설치된 기본 대시보드 확인 : Dashboards → Browse
- (대략) 분류 : 자원 사용량 - Cluster/POD Resources, 노드 자원 사용량 - Node Exporter, 주요 애플리케이션 - CoreDNS 등
- 확인해볼 내용 - K8S / CR / Cluster, Node Exporter / Use Method / Cluster
공식 대시보드
Dashboards | Grafana Labs
grafana.com
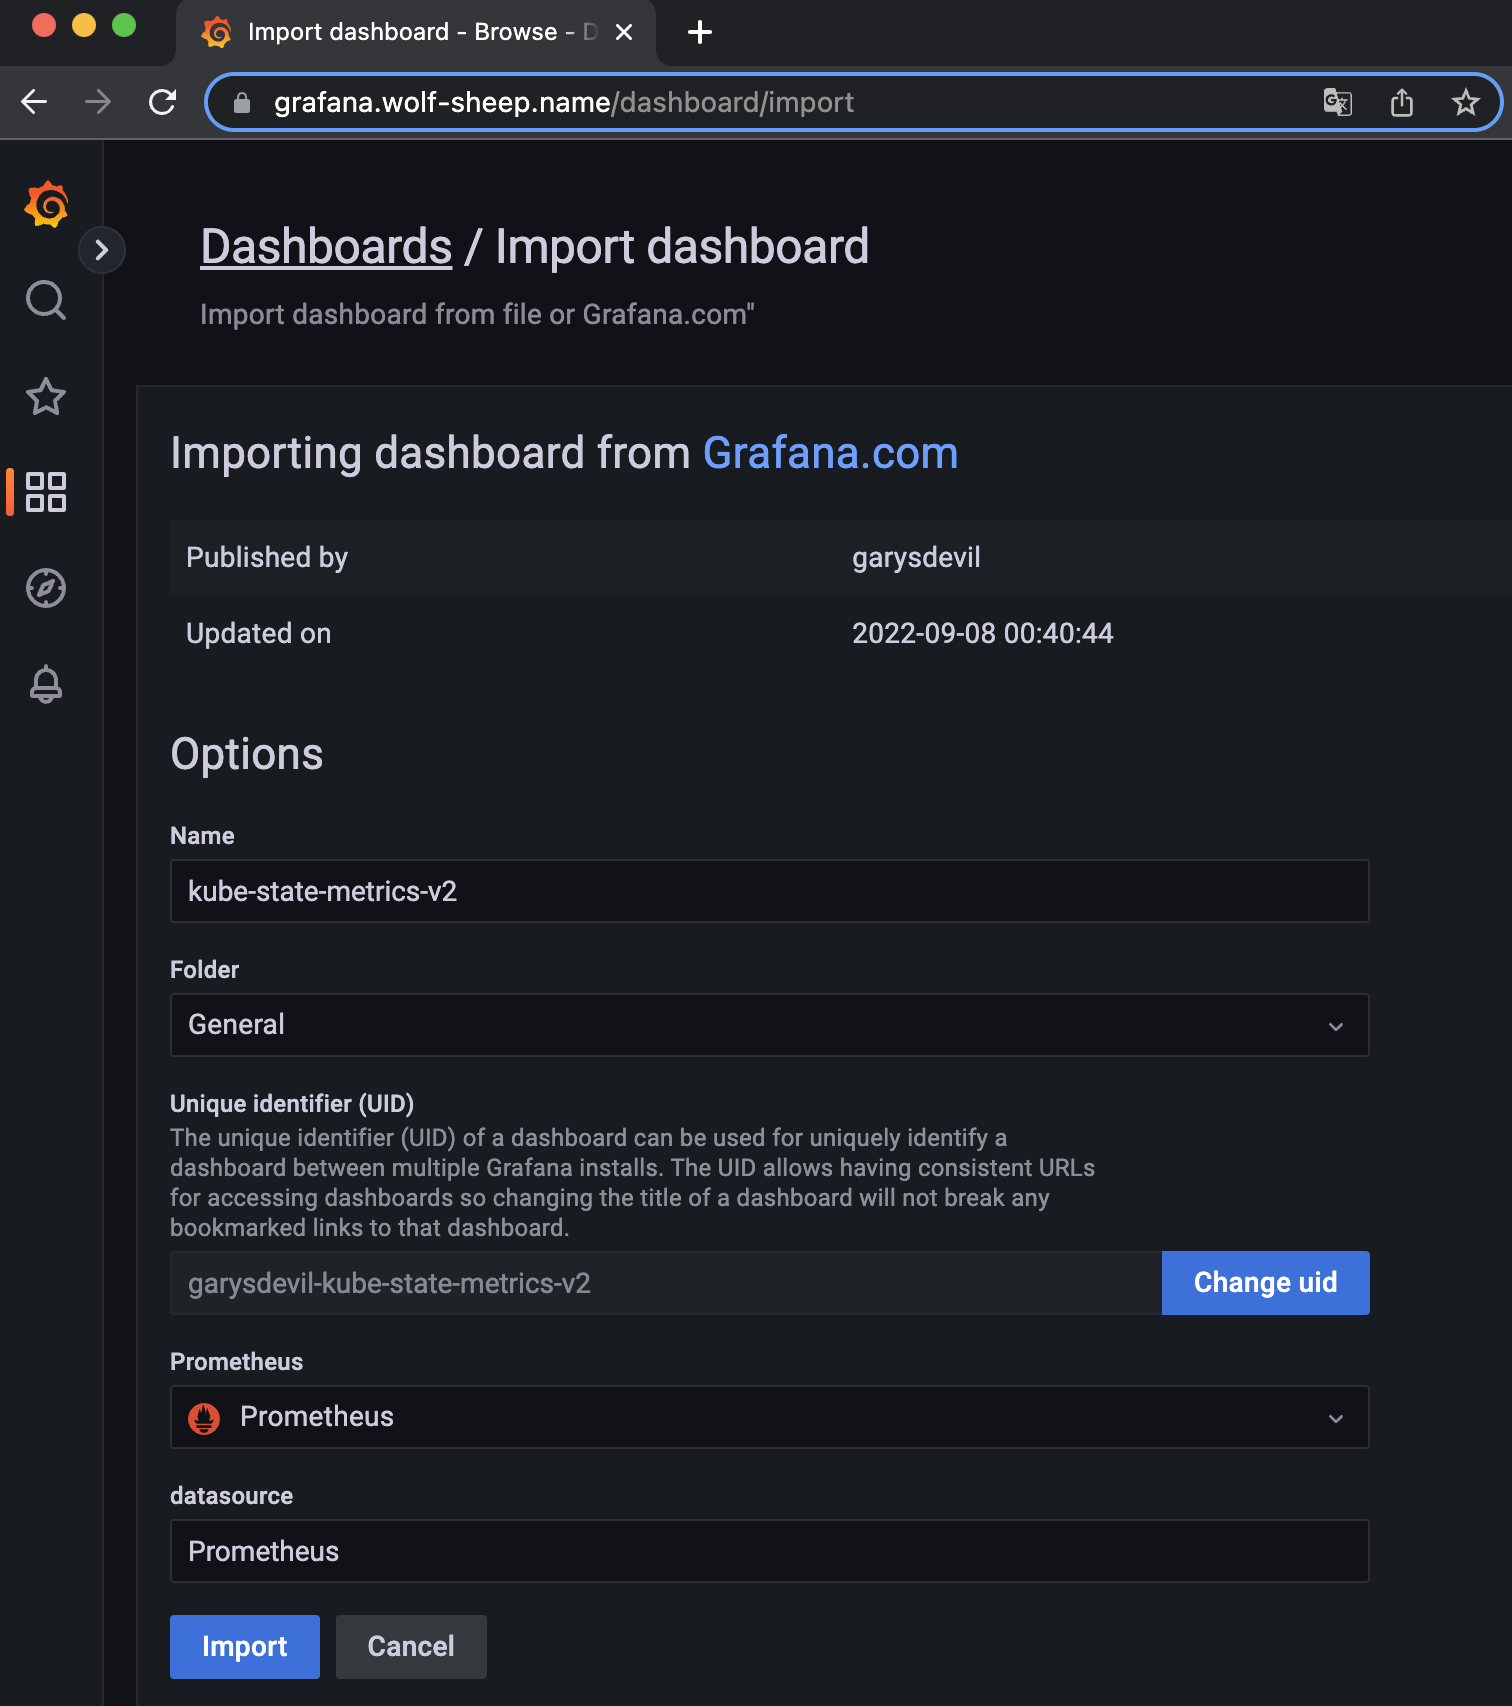
- kube-syate-metrics-v2 가져와보자!! >> Dashboard ID copied! (13332) 클릭 - 링크
- [kube-syate-metrics-v2] Dashboard → Import → 13332 입력 후 Load ⇒ 데이터소스(Prometheus 선택) 후 Import 클릭
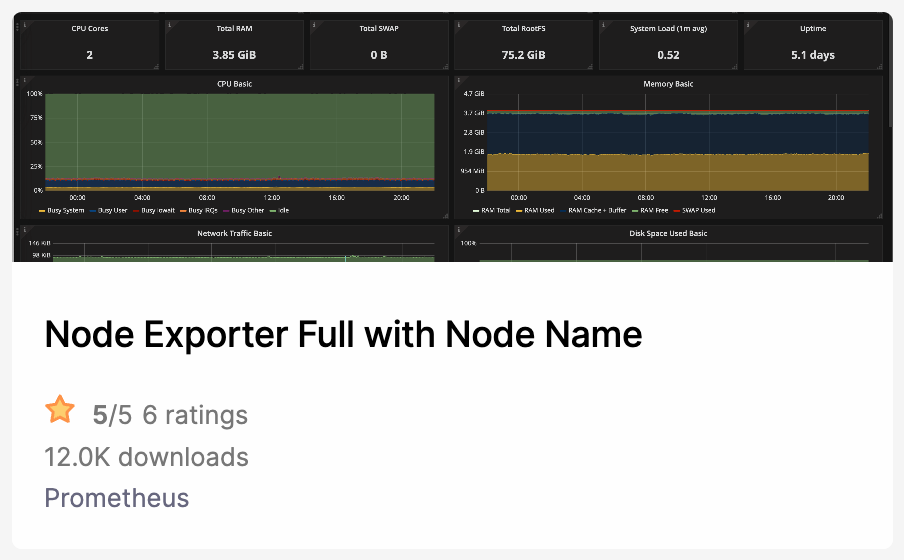
- [Node Exporter Full] Dashboard → Import → 1860 입력 후 Load ⇒ 데이터소스(Prometheus 선택) 후 Import 클릭
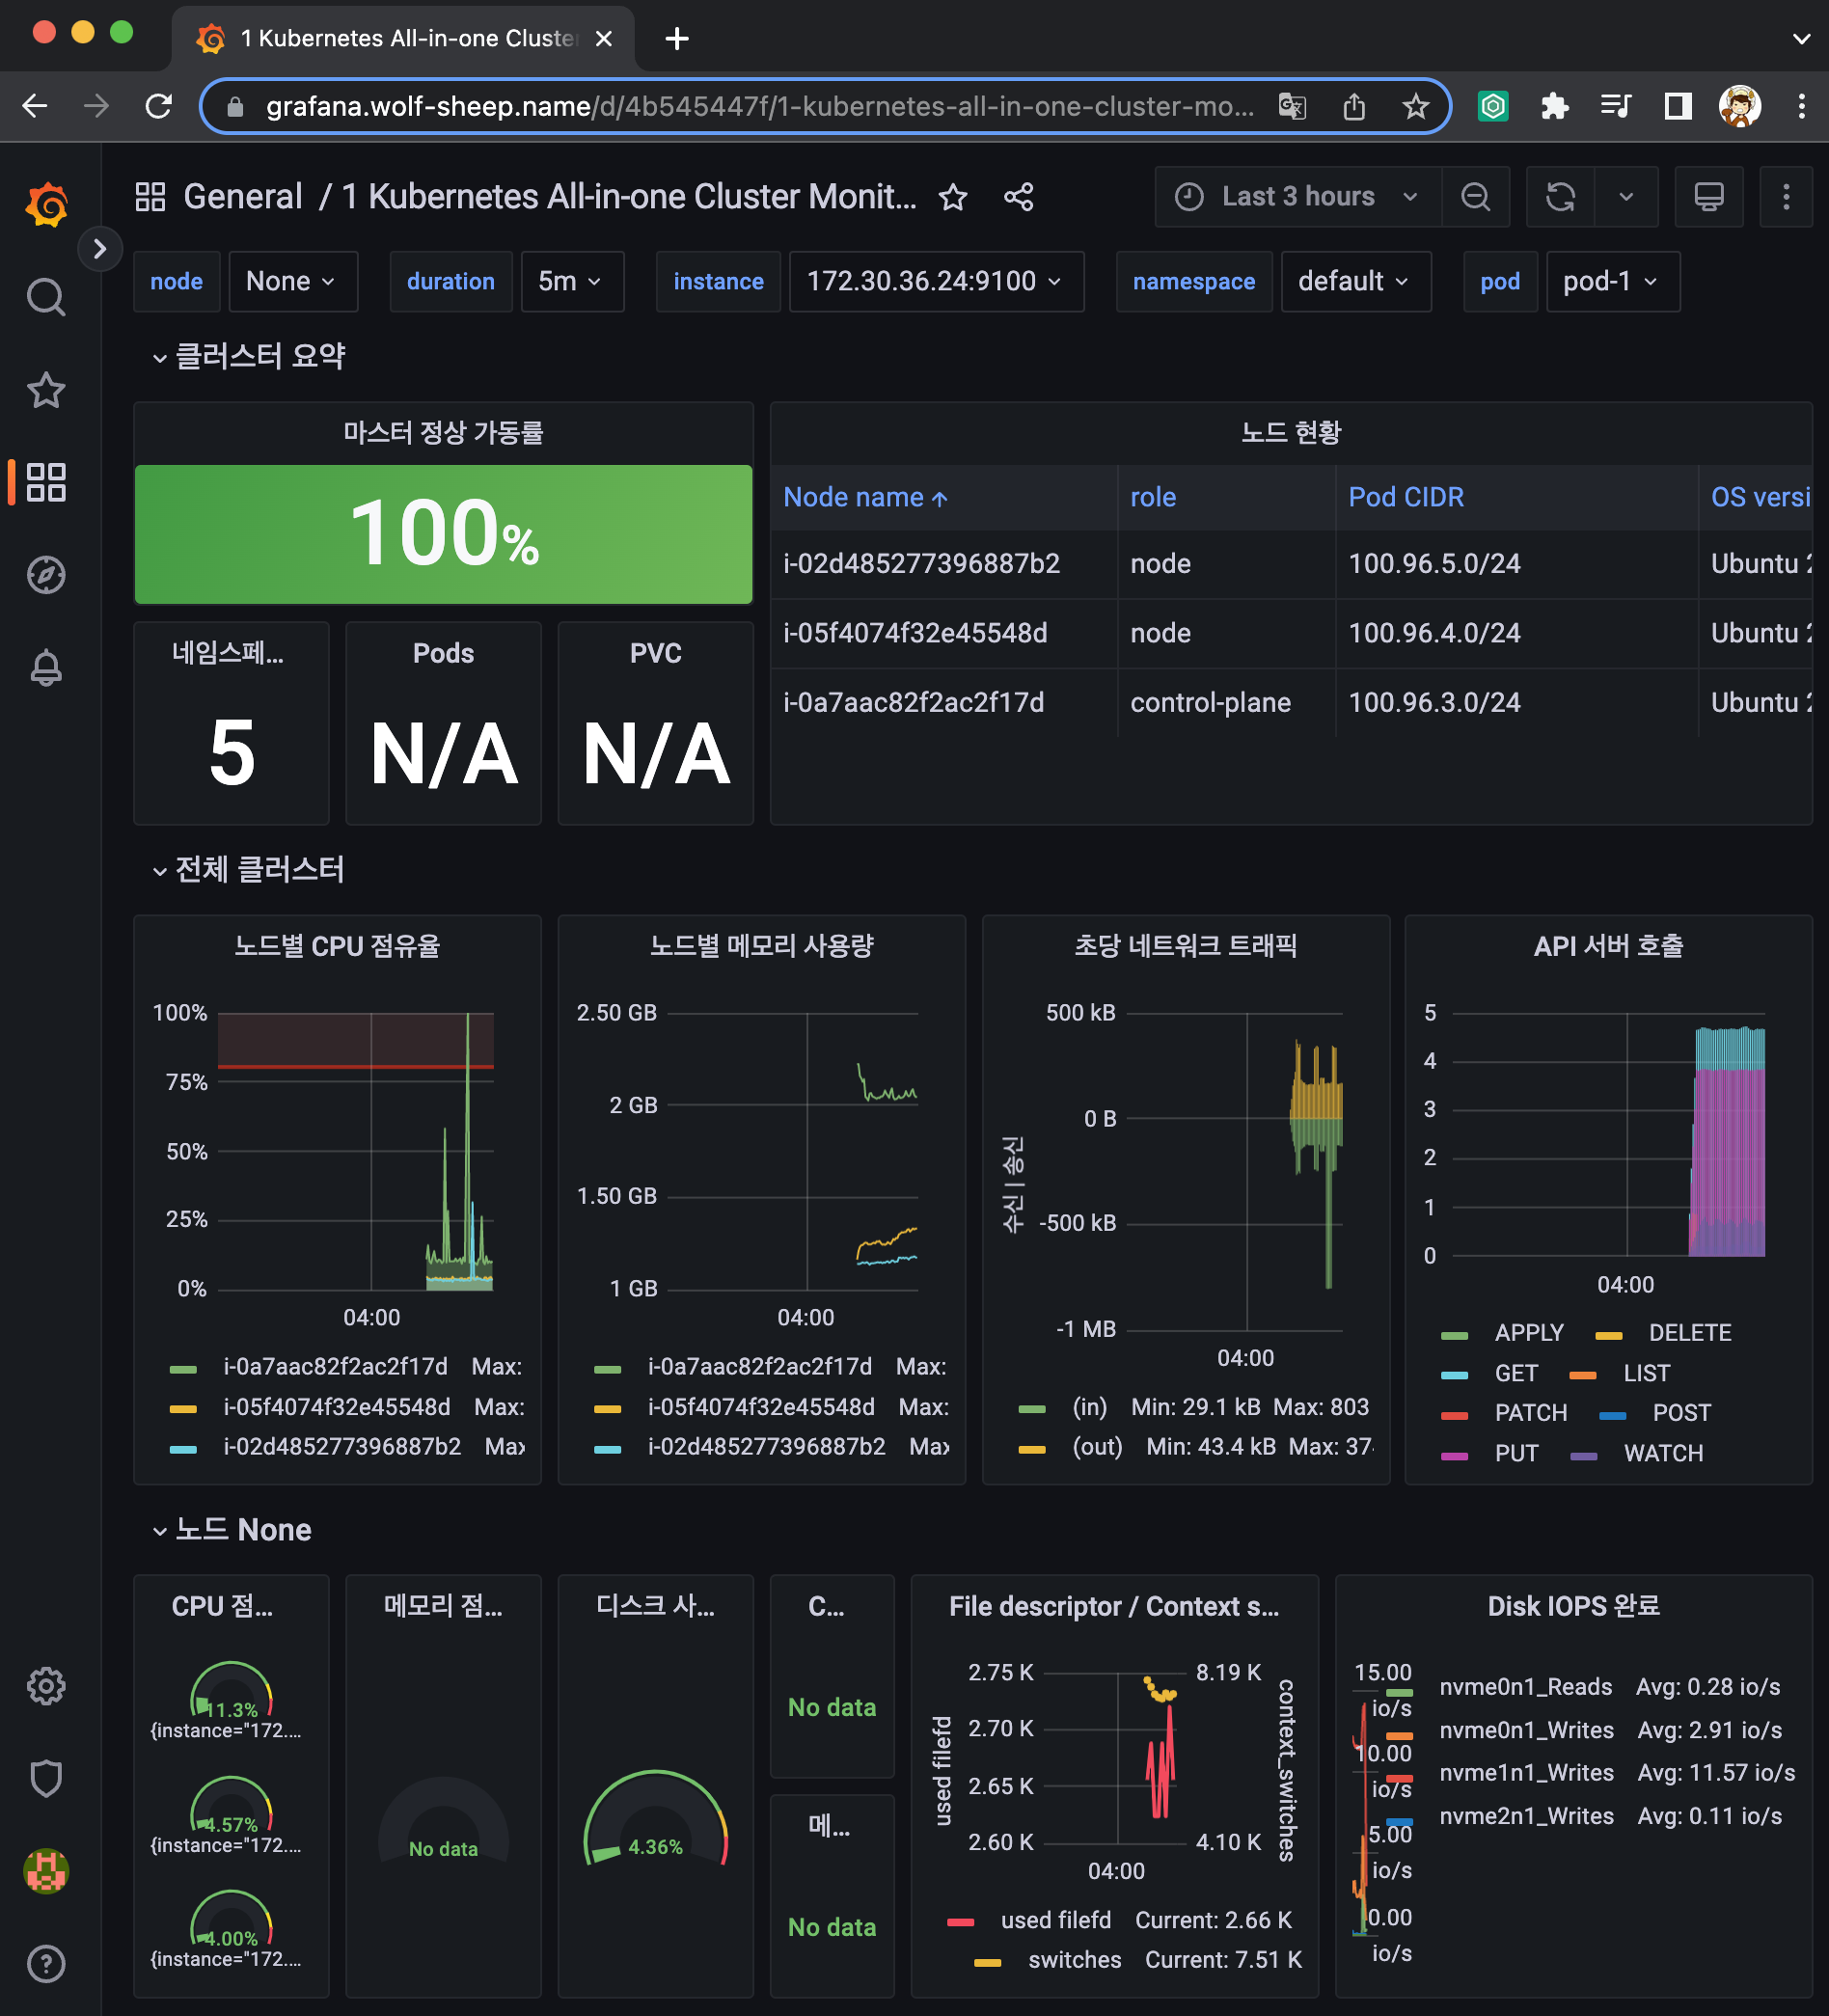
- [1 Kubernetes All-in-one Cluster Monitoring KR] Dashboard → Import → 13770 입력 후 Load ⇒ 데이터소스(Prometheus 선택) 후 Import 클릭

NGINX 웹서버 배포 및 애플리케이션 모니터링 설정 및 접속
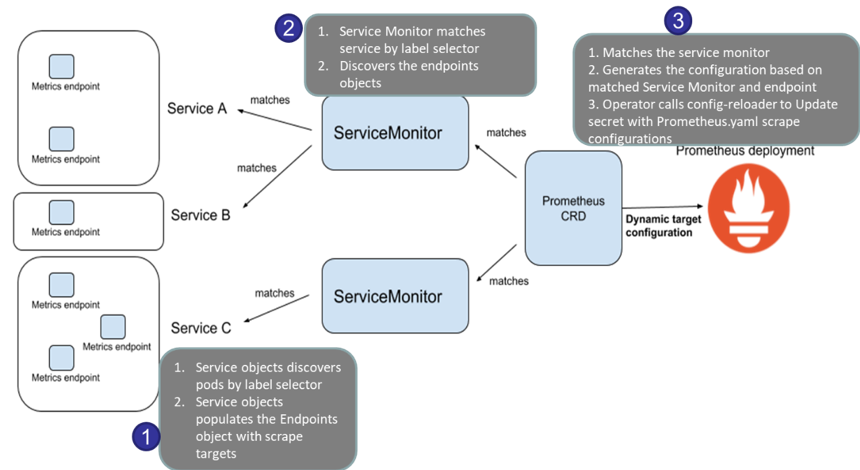
- nginx 관련 helm 설치 시, 프로메테우스 익스포터 Exporter 옵션 설정 시, 자동으로 nginx 를 프로메테우스 모니터링에 등록 가능!
- 프로메테우스 설정에서 nginx 모니터링 관련 내용을 서비스 모니터 CRD로 추가 가능!
- 기존 애플리케이션 파드에 프로메테우스 모니터링을 추가하려면 사이드카 방식을 사용하며 exporter 컨테이너를 추가!
- nginx 웹 서버 helm 설치 진행!!
# helm 레포지토리 추가
helm repo add bitnami https://charts.bitnami.com/bitnami
# 파라미터 파일 생성 : 서비스 모니터 방식으로 nginx 모니터링 대상을 등록하고, export 는 9113 포트 사용, nginx 웹서버 노출은 AWS CLB 기본 사용
cat <<EOT > ~/nginx-values.yaml
metrics:
enabled: true
service:
port: 9113
serviceMonitor:
enabled: true
namespace: monitoring
interval: 10s
EOT
# 배포
helm install nginx bitnami/nginx --version 13.2.23 -f nginx-values.yaml
# CLB에 ExternanDNS 로 도메인 연결
kubectl annotate service nginx "external-dns.alpha.kubernetes.io/hostname=nginx.$KOPS_CLUSTER_NAME"
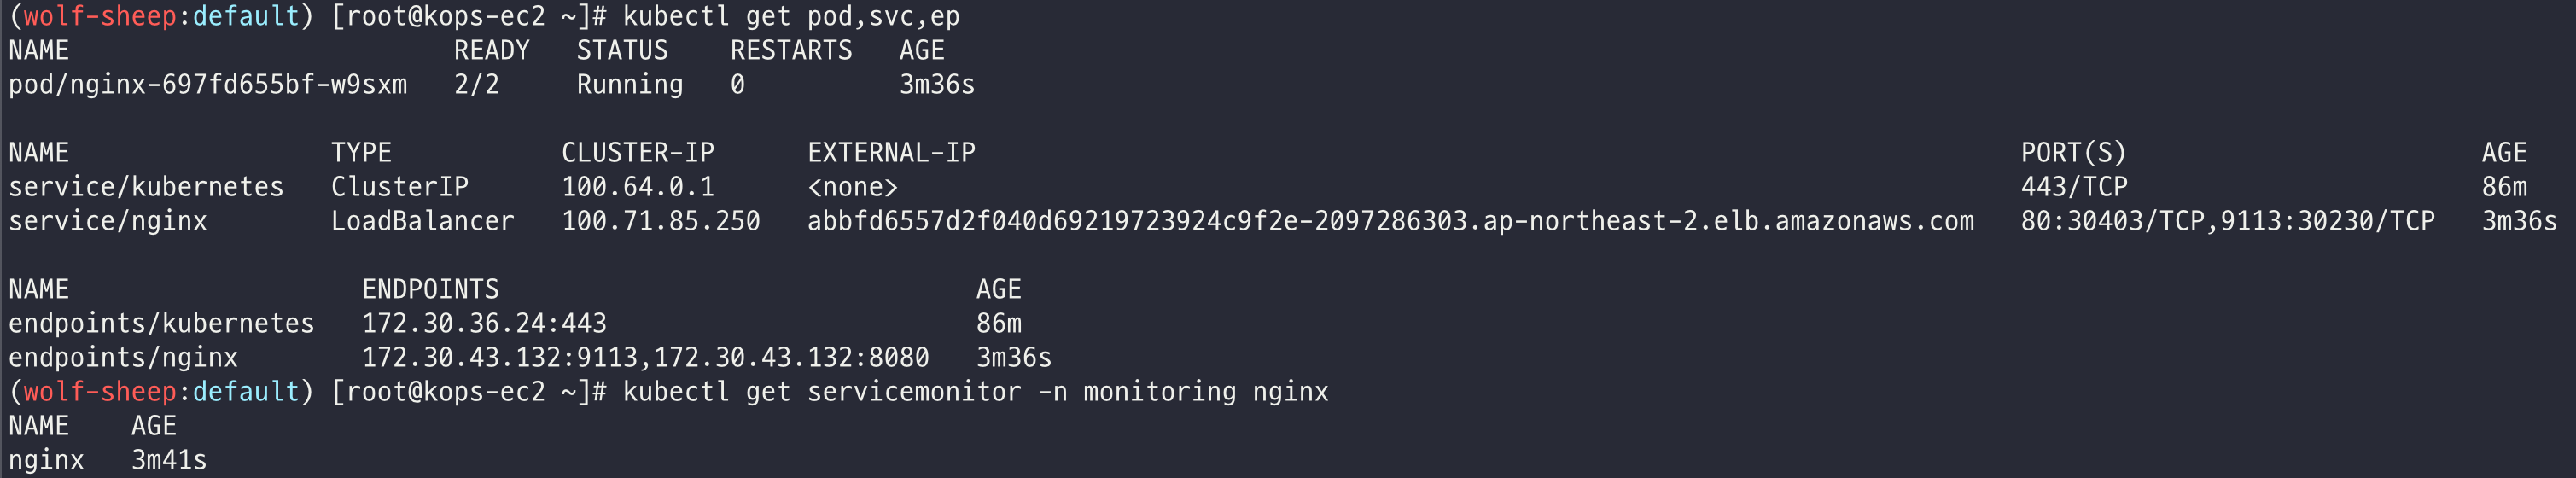
# 확인
kubectl get pod,svc,ep
kubectl get servicemonitor -n monitoring nginx
kubectl get servicemonitor -n monitoring nginx -o json | jq
# nginx 파드내에 컨테이너 갯수 확인
kubectl get pod -l app.kubernetes.io/instance=nginx
kubectl describe pod -l app.kubernetes.io/instance=nginx
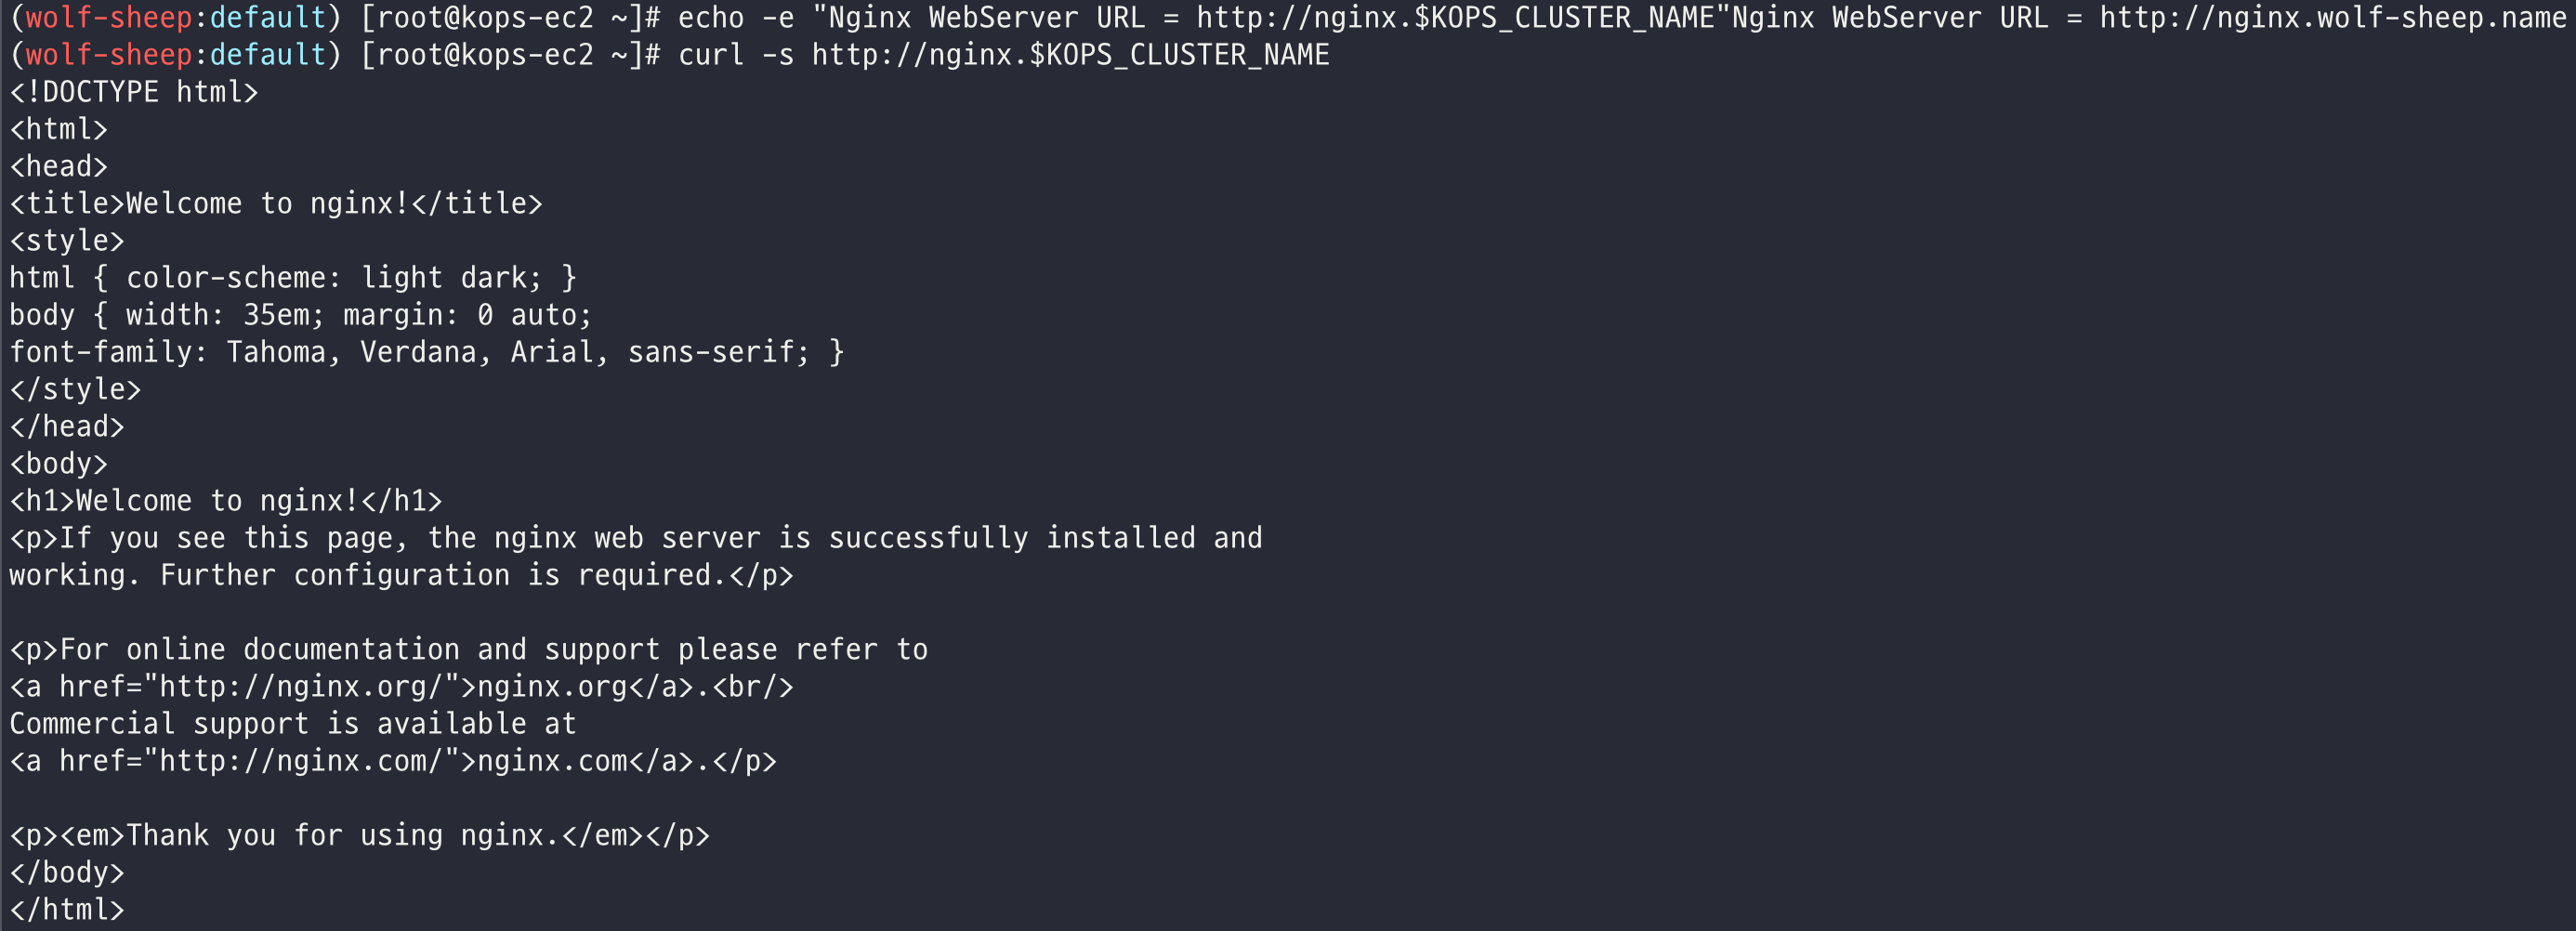
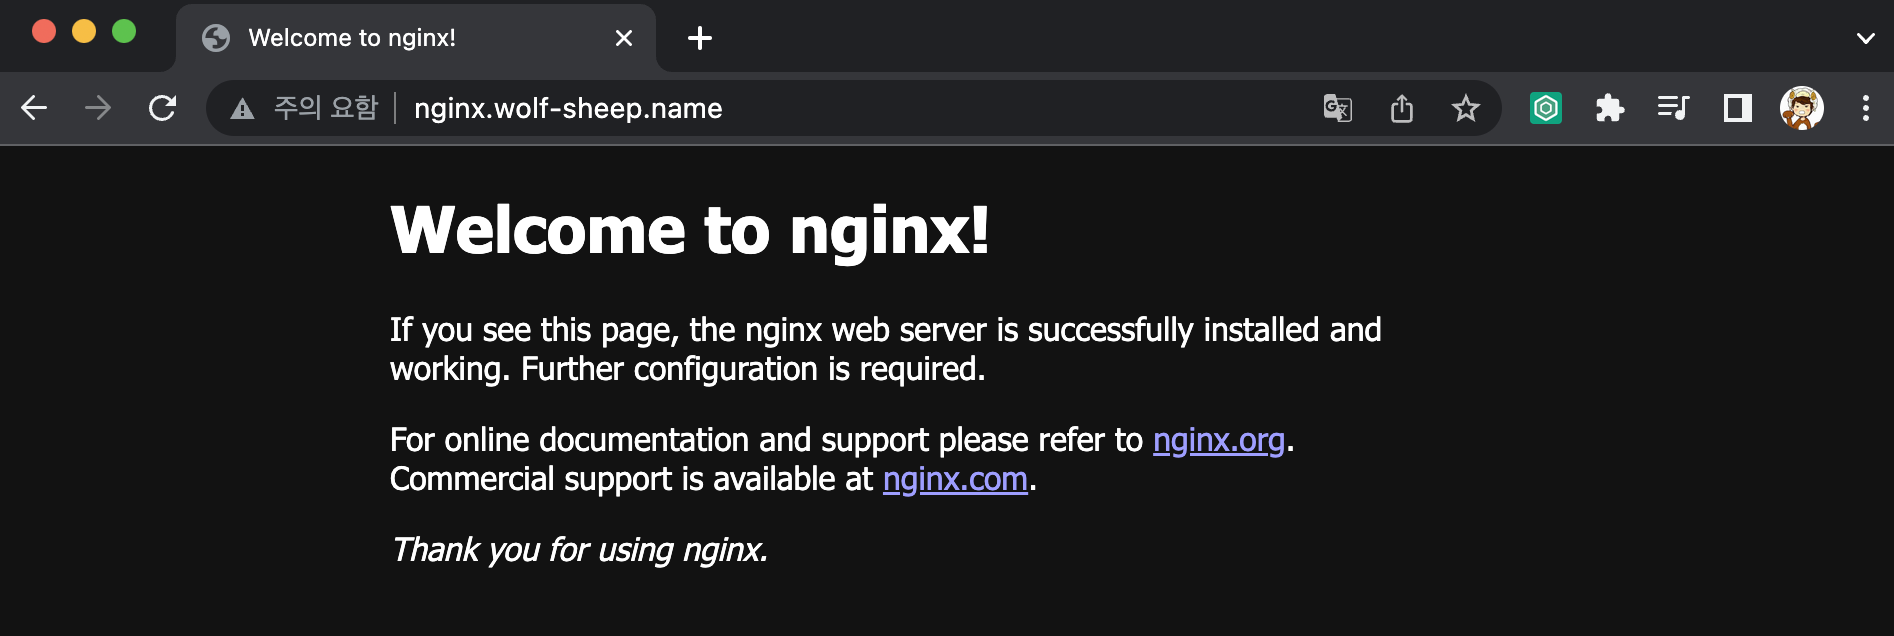
# 접속 주소 확인 및 접속
echo -e "Nginx WebServer URL = http://nginx.$KOPS_CLUSTER_NAME"
curl -s http://nginx.$KOPS_CLUSTER_NAME
kubectl logs deploy/nginx -f
# 반복 접속
while true; do curl -s http://nginx.$KOPS_CLUSTER_NAME -I | head -n 1; date; sleep 1; done

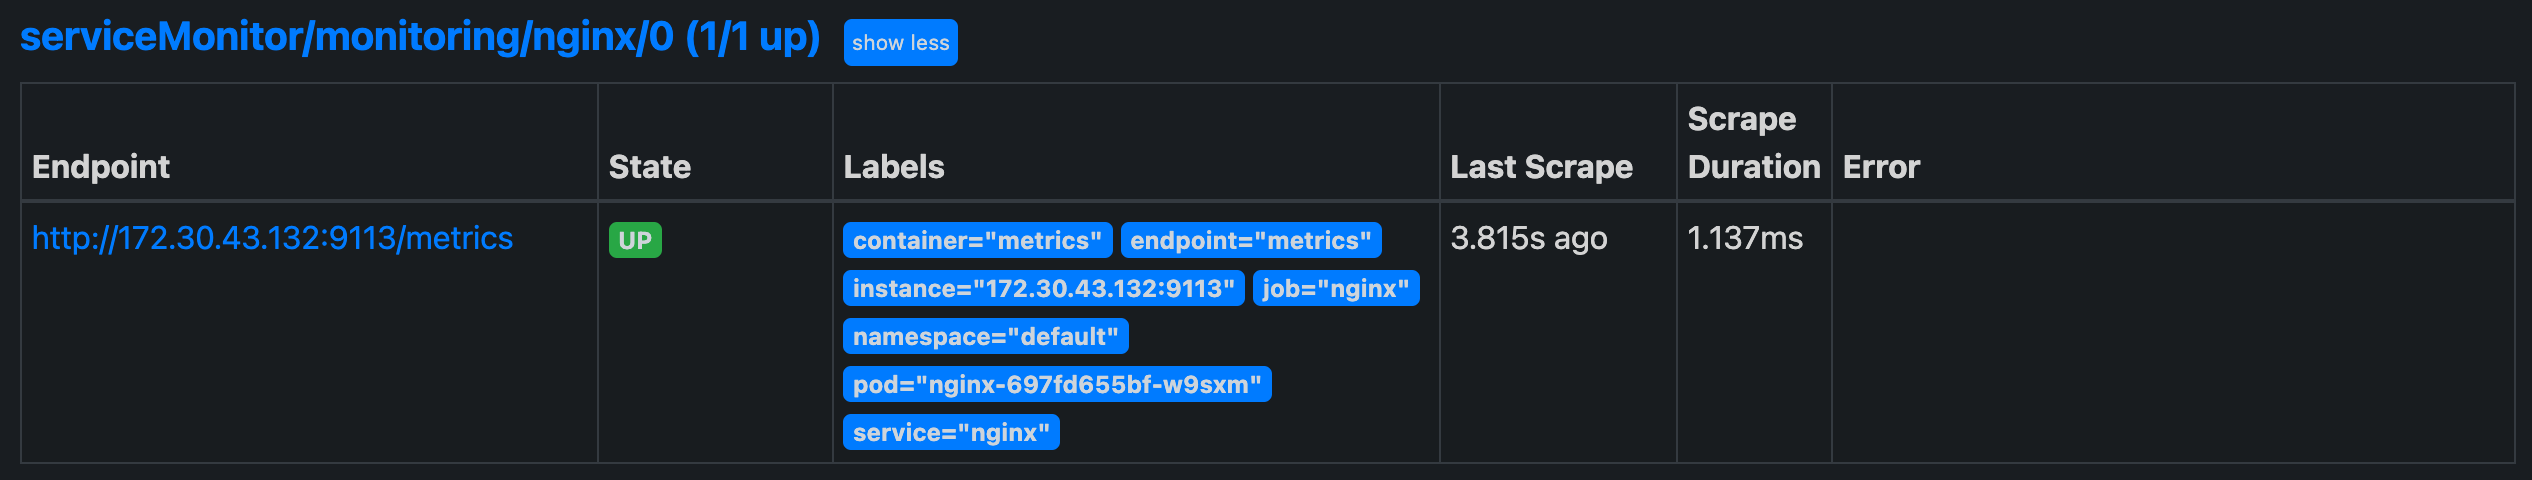
- 서비스 모니터링 생성 후 1분 정도 후, 프로메테우스 웹서버에서 Status → Targets 에 nginx 서비스 모니터 추가 확인
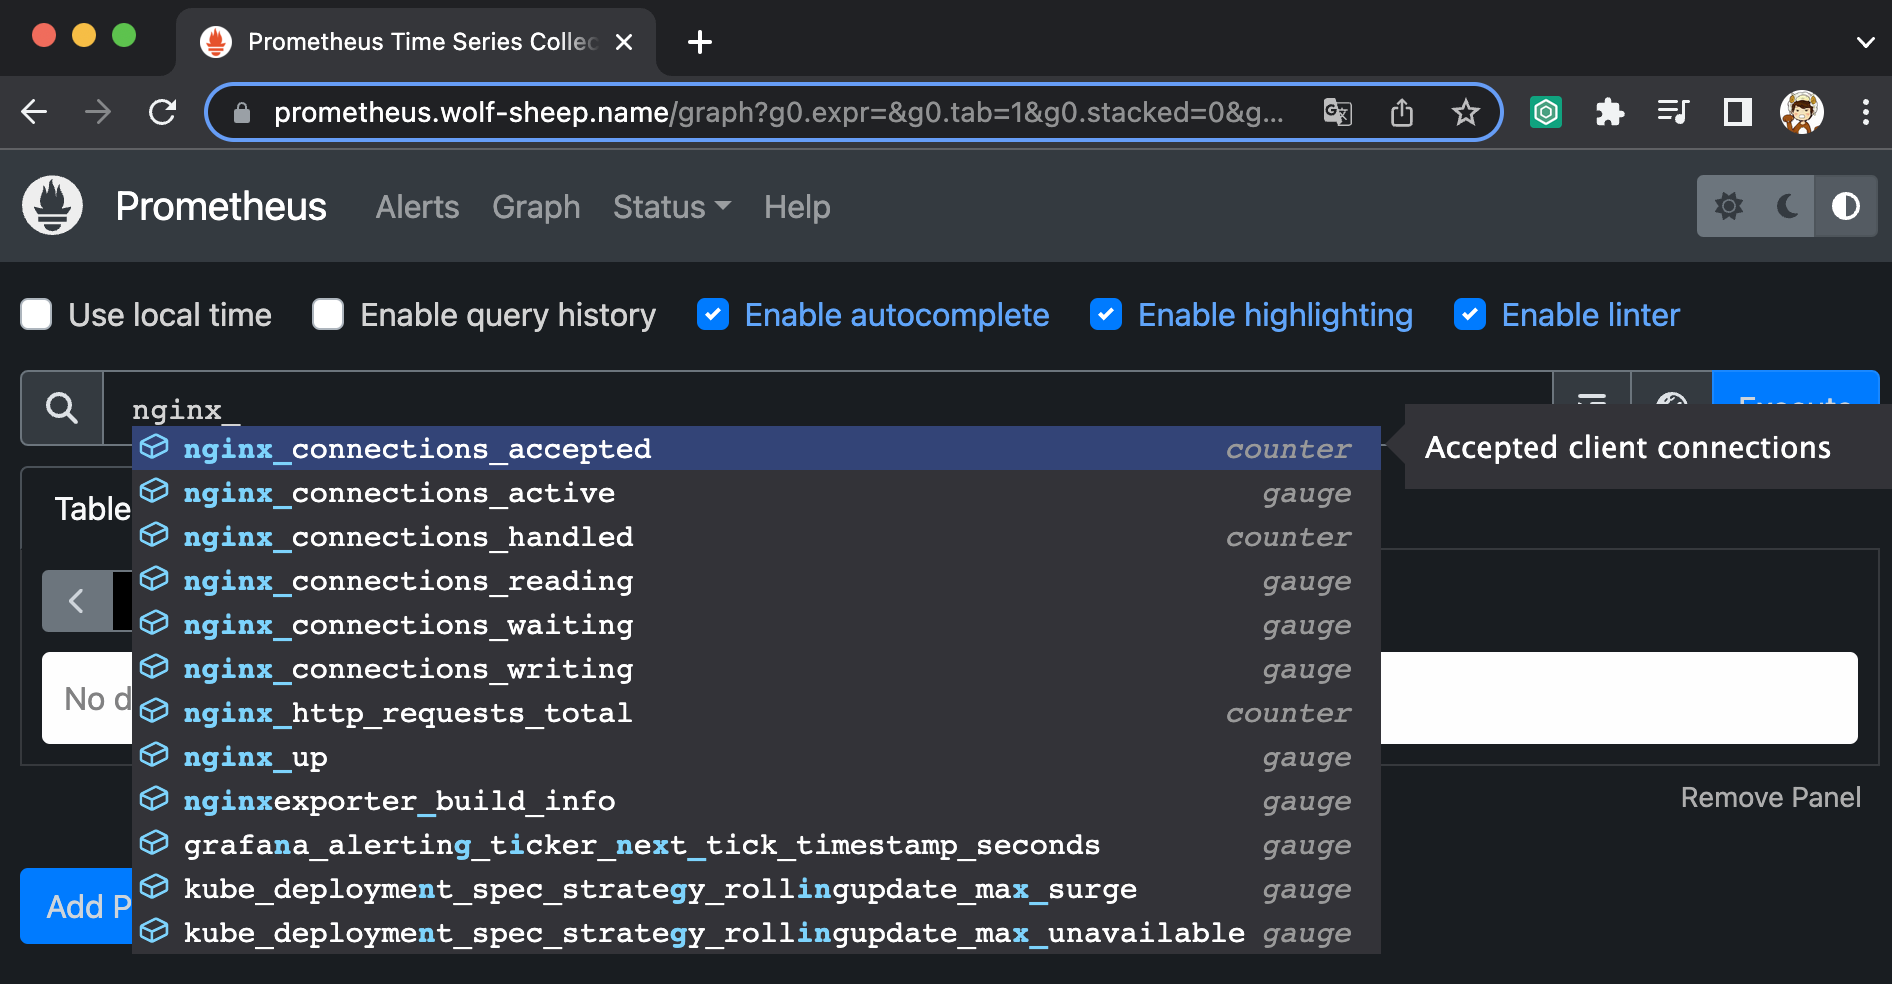
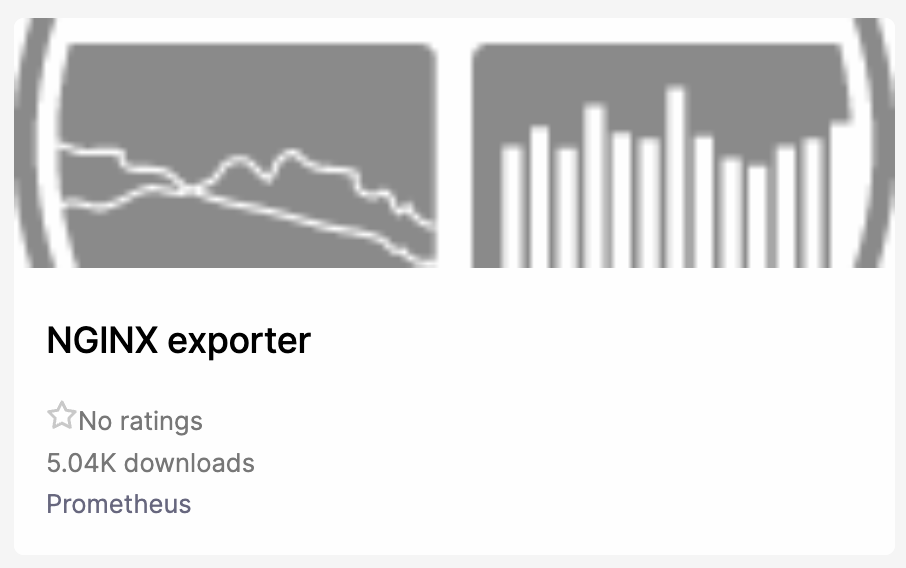
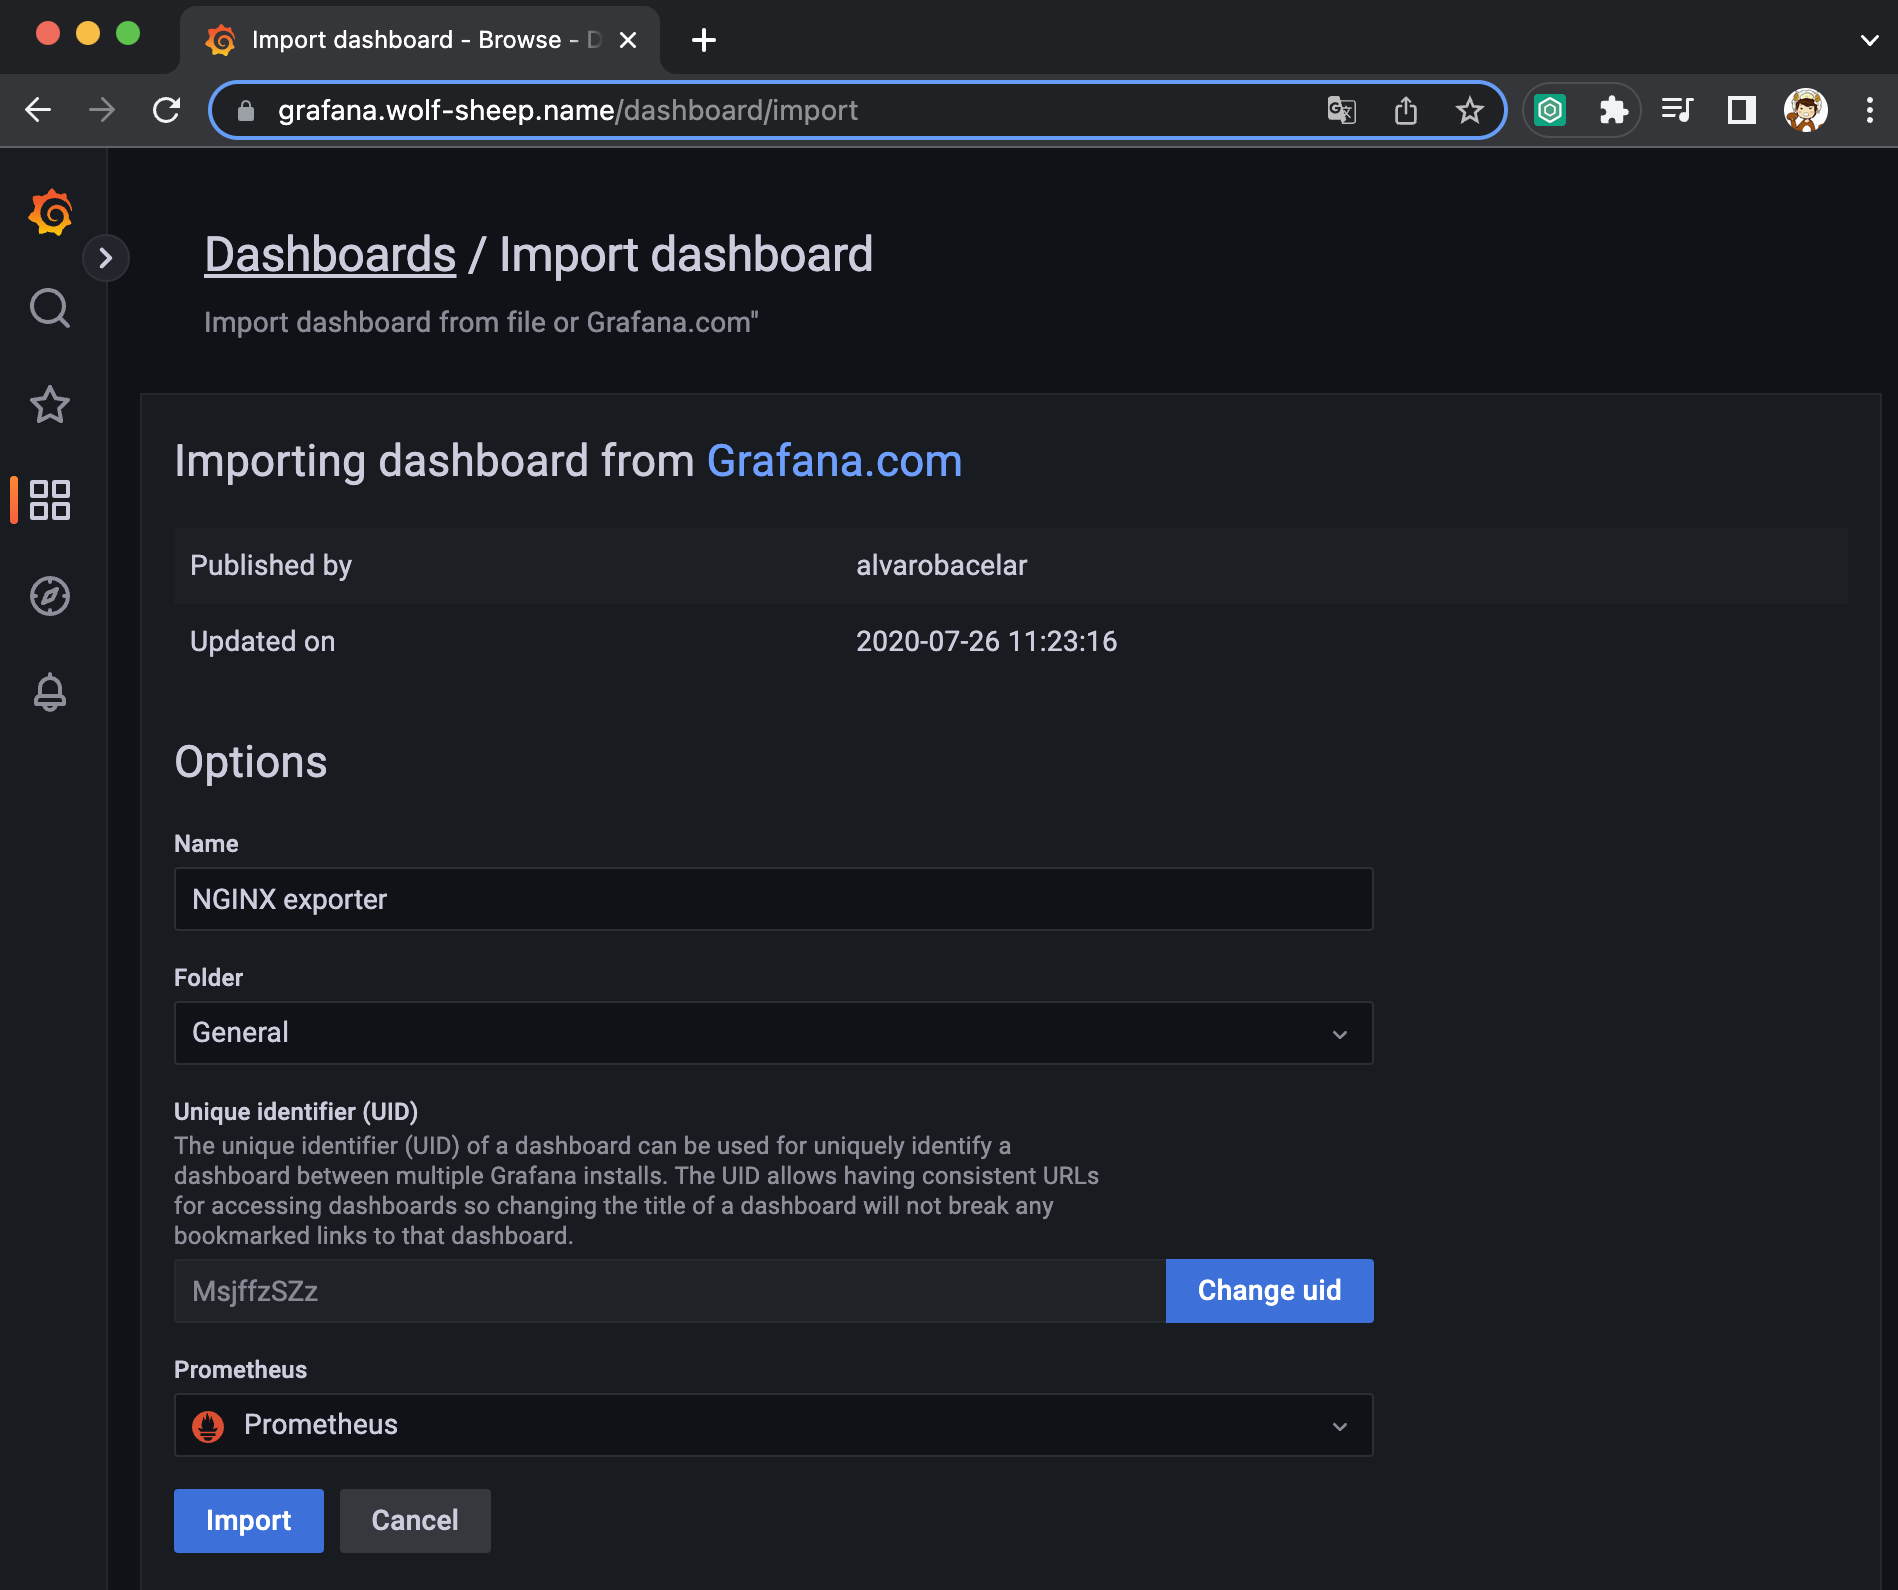
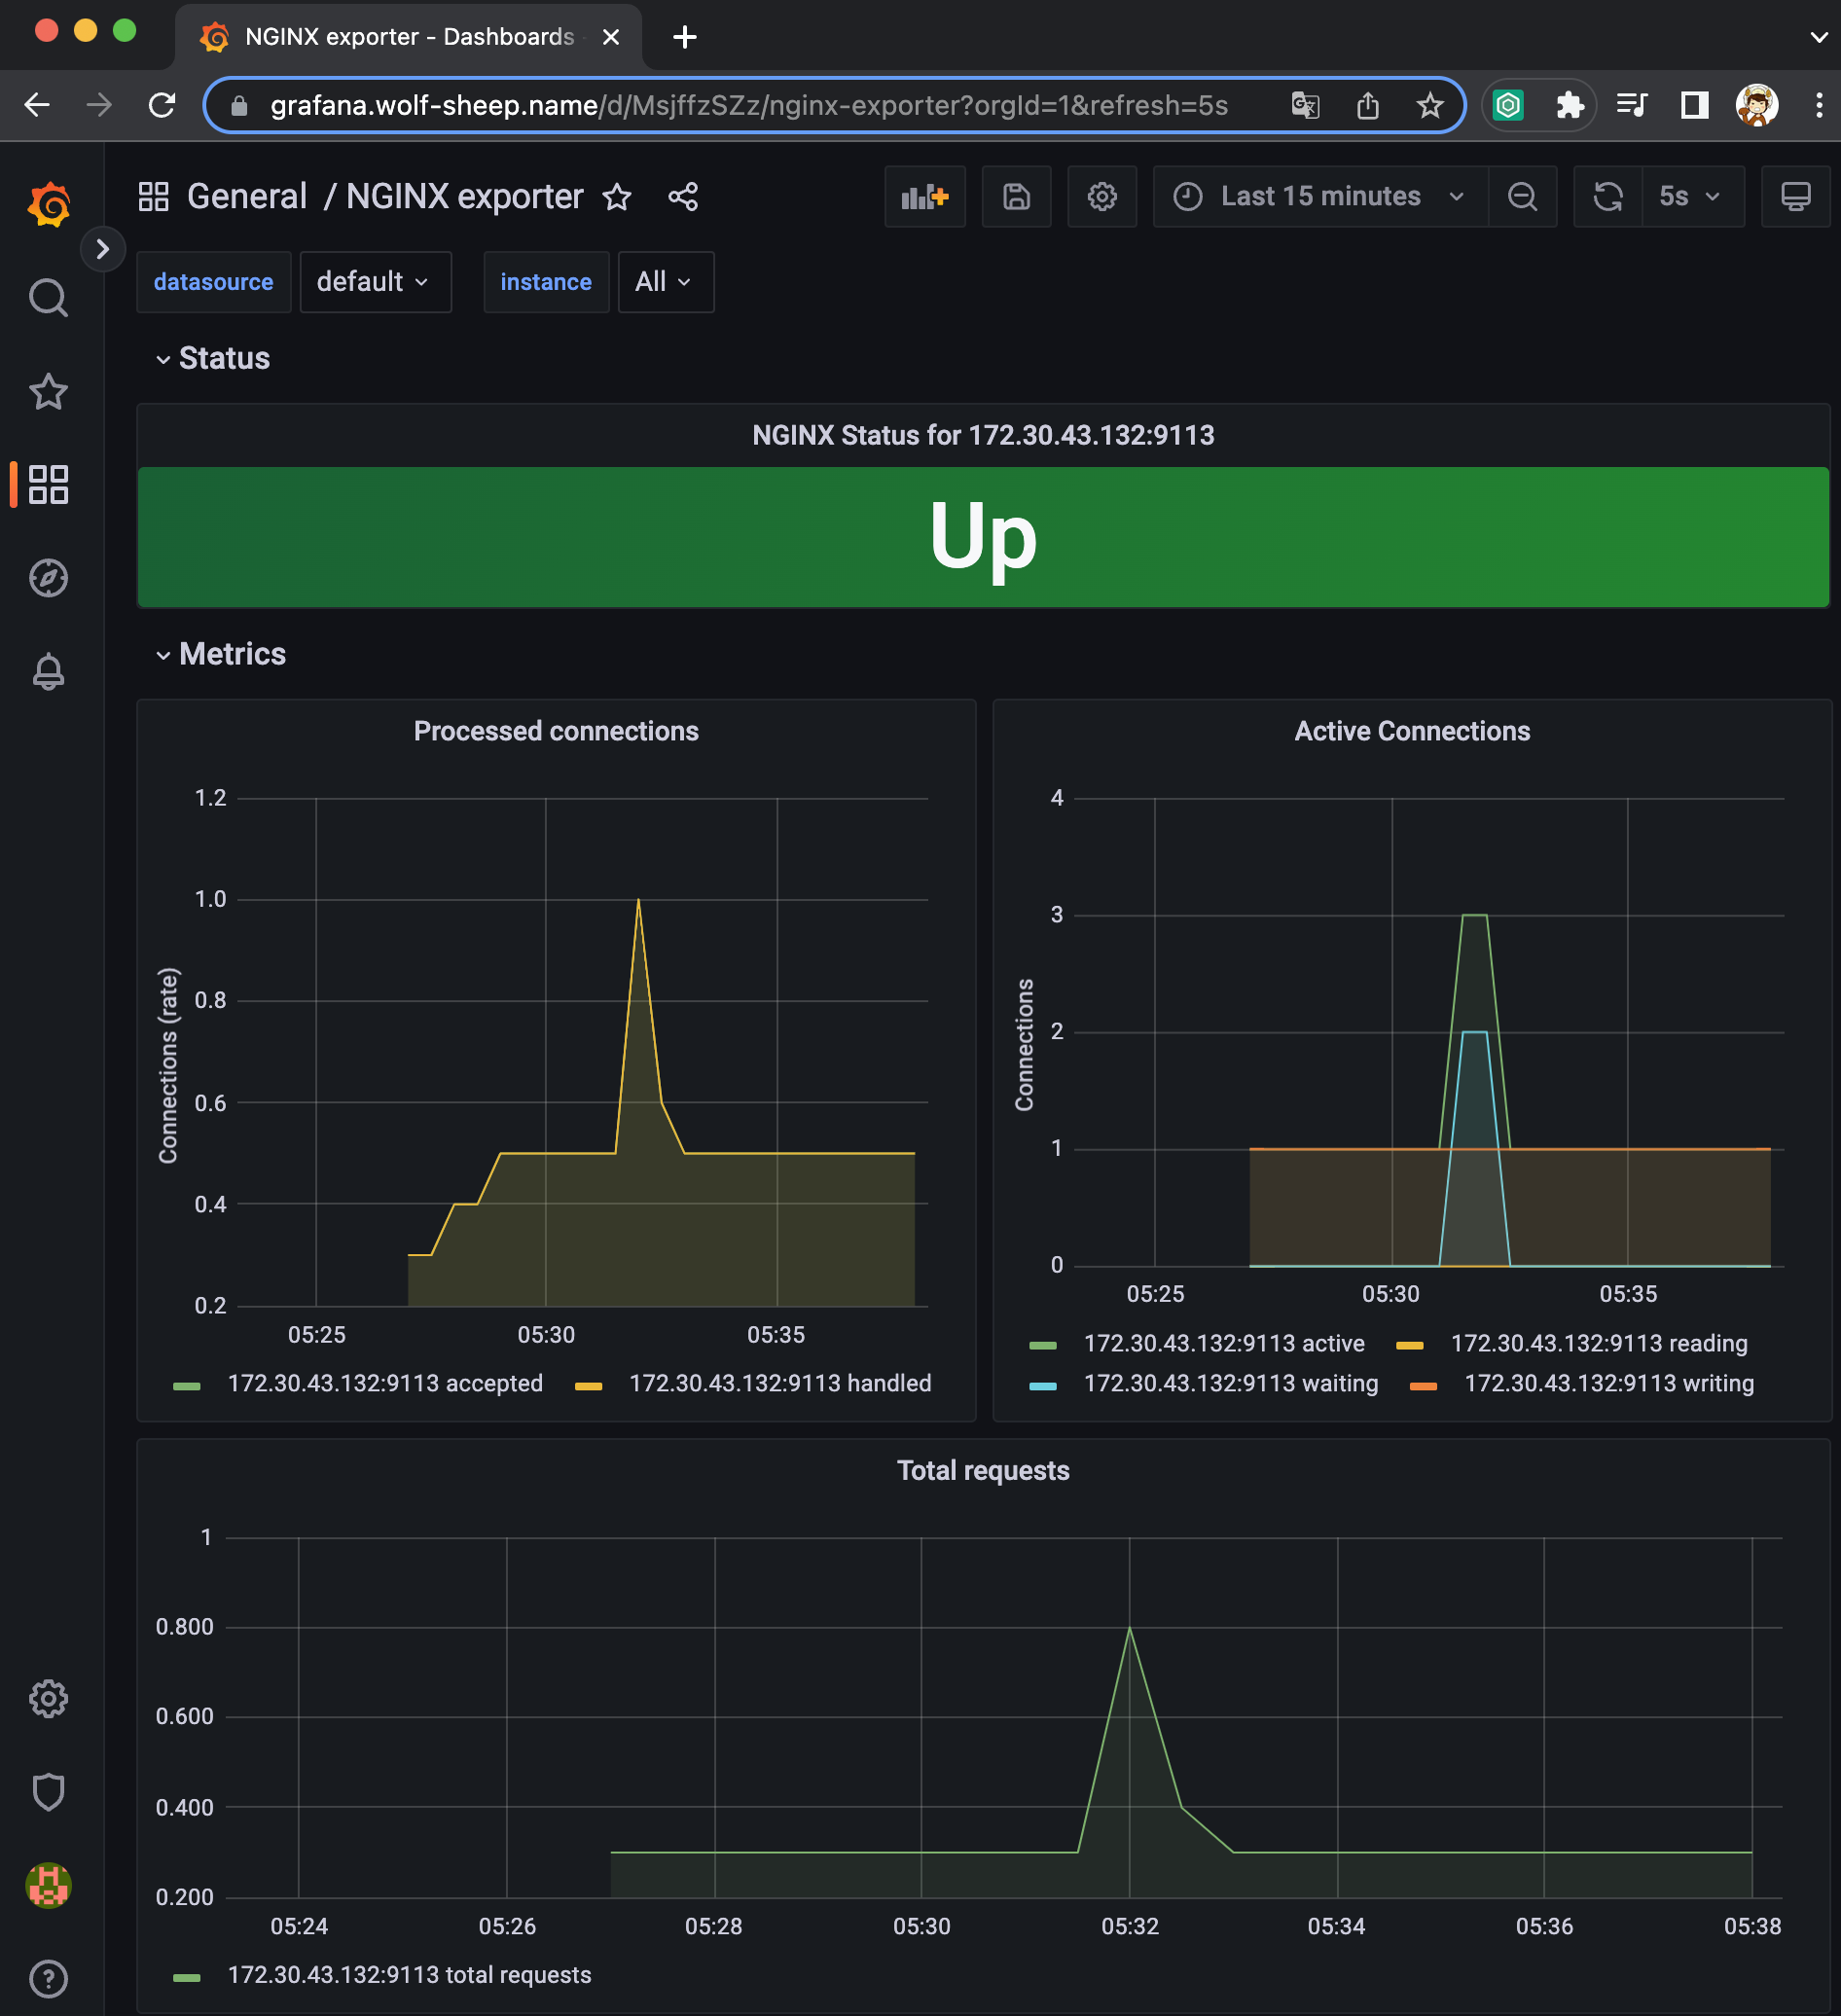
NGINX 애플리케이션 모니터링 대시보드 추가


(실습 완료 후) 자원 삭제
# helm 차트 삭제

# nginx 삭제
helm uninstall nginx

# 프로메테우스 스택 삭제
helm uninstall -n monitoring kube-prometheus-stack


# kOps 클러스터 삭제 & AWS CloudFormation 스택 삭제
kops delete cluster --yes && aws cloudformation delete-stack --stack-name mykops
과제
과제 1. 프로메테우스-스택 설치 후 '공식 or 여러가지 대시보드'를 추가해보시고, 관련 스샷 올려주세요


과제 2. NGINX 파드를 배포 후 관련 metric 을 프로메테우스 웹에서 확인하고, 그라파나에 nginx 대시보드를 추가 후 확신하시고 관련 스샷 올려주세요


긴 글 읽어주셔서 감사합니다 👻
'k8s > CloudNet@' 카테고리의 다른 글
| [CloudNet@] Production Kubernetes Online Study - 7주차. (a.k.a FINAL) (0) | 2023.03.05 |
|---|---|
| [CloudNet@] Production Kubernetes Online Study - 6주차. (0) | 2023.02.25 |
| [CloudNet@] Production Kubernetes Online Study - 4주차. (0) | 2023.02.12 |
| [CloudNet@] Production Kubernetes Online Study - 3주차. (0) | 2023.02.05 |
| [CloudNet@] Production Kubernetes Online Study - 2주차. (0) | 2023.01.29 |